Traffic Capture & Analysis
Profitap AcademyTraffic capture and analysis are essential for a wide range of analytics and forensic needs. Whether it is in the data center, a part of a building, a whole campus, or a branch office, a well implemented traffic capture, and analysis solution helps track down performance and security issues in the least amount of time possible, keeping the business secure and performant.
Explore our training videos, white papers, and use cases and learn all you need to know about capturing your network data, monitoring your network performance and troubleshooting with ProfiShark and IOTA.
Videos
Traffic Capture & Analysis
Checking Video Rendering Performance
See how John Modlin measures and analyzes the performance of his video rendering he uploaded on YouTube using IOTA.
Copy Video Link
Measuring Device Latency With the ProfiShark
Determining the latency that a device adds to the network can be difficult. In this video, Mike Pennacchi with Network Protocol Specialists, LLC shows how the ProfiShark can be used to accurately measure that amount of time it takes for a device to forward packets.
Copy Video Link
ProfiShark Performance Testing
Tony uses a traffic generator to compare ProfiShark’s performance with other packet capture tools on the market.
Copy Video Link
IOTA Training
-
IOTA Quick Start | 10 minutes
IOTA Quick Start
In this video Mike Pennacchi will go through how to get started with the Profitap IOTA.
Copy Video Link
-
IOTA Hardware Overview | 14 minutes
IOTA Hardware Overview
Take a look at the interface of the IOTA 1G and 10G and learn how you can easily set up and activate these devices.
Copy Video Link
-
IOTA Connecting & Interface Configuration | 12 minutes
IOTA Connecting & Interface Configuration
Deploying IOTA will not introduce a new vulnerability to your network. Discover how to connect and configure the IOTA in-line or in SPAN mode.
Copy Video Link
-
IOTA Starting Capture & Filtering | 26 minutes
IOTA Starting Capture & Filtering
After connecting the IOTA to the network, Mike shows how you can start capturing packets and use Dashboard to quickly drill down into the captured traffic.
Copy Video Link
Getting Started | 4 videos
IOTA Use Cases
Isolating Traffic of Interest with IOTA Search
Learn from John Modlin as he shows you how to use the IOTA search to narrow down the network traffic.
Copy Video Link
Packet Capture Performance: Where does IOTA fit?
In this video, Chris Greer shows the key areas where IOTA should be deployed in your network infrastructure.
Copy Video Link
Troubleshooting VPN Issues
In this video Mike Pennacchi will take a look into how we can use the IOTA to troubleshoot VPN problems.
Copy Video Link
Analyzing Communication Protocols
John Modlin shows how you can easily analyze the FTP, TELNET, SSH or RDP traffic using IOTA’s Communication Protocols Dashboards.
Copy Video Link
Monitoring BitTorrent Traffic
John Modlin shows how you can quickly identify Bit Torrent traffic using filters on the IOTA Explore Dashboard.
Copy Video Link
Troubleshooting Intermittent Problems
When it comes to troubleshooting network problems, Intermittent Problems are some of the toughest to resolve. In this video, Mike Pennacchi shows how you can reliably get to the root cause using IOTA.
Copy Video Link
Webinars
Webinar: IOTA from A to Z
In this webinar, you will learn how to connect IOTA to your network, start capturing packets and use the Dashboard to drill down into the captured traffic.
Copy Video Link
Webinar: Troubleshooting VPN Issues
Experiencing issues with your VPN connection while working from home? In this webinar we will show you causes of VPN connection problems and help you with some troubleshooting tips that might help you solve the problems you are dealing with remotely.
Copy Video Link
Webinar: Getting the Right Packets the First Time
In this webinar, Mike Pennacchi shows you how to capture the right packets accurately using our Booster and IOTA combined with NetAlly EtherScope™ nXG.
Copy Video Link
Use Cases & Solution Briefs
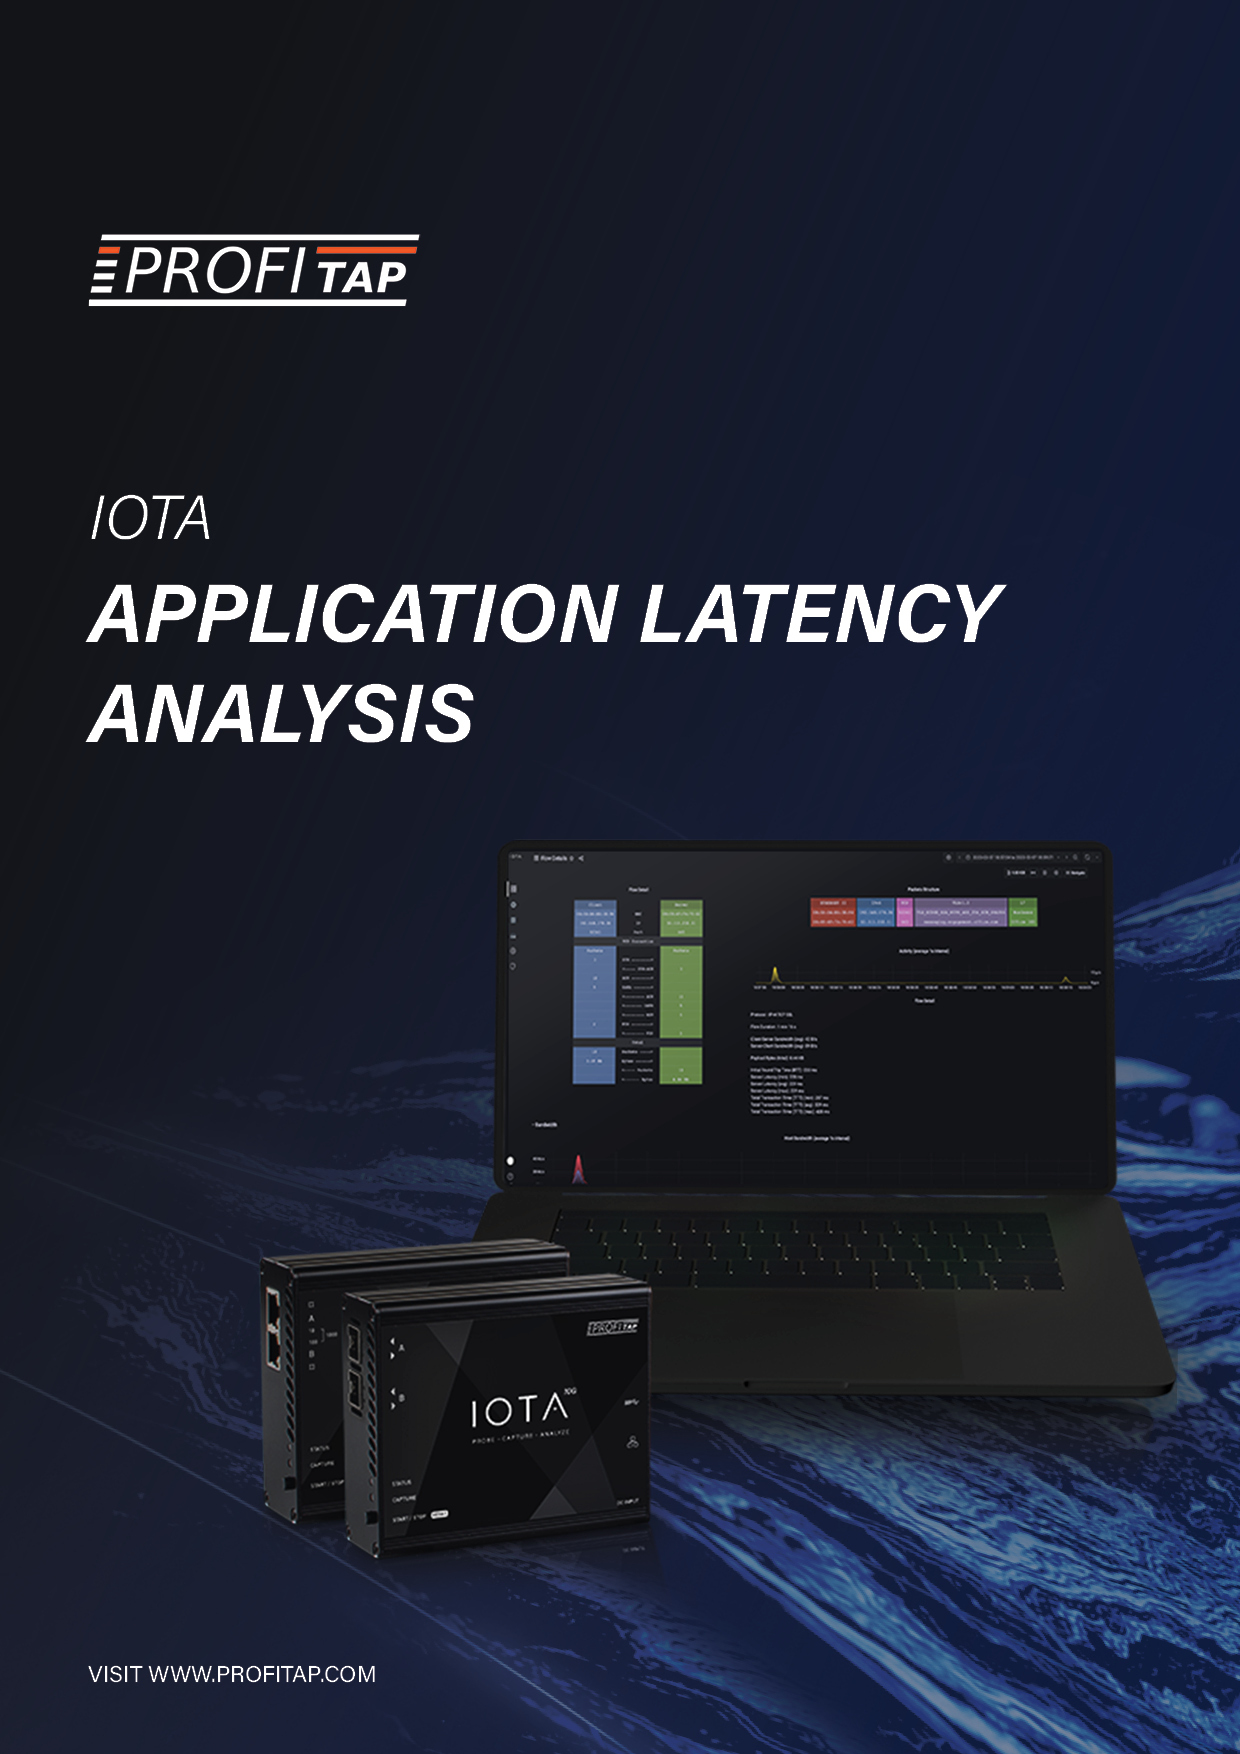
Application Latency Analysis
More and more applications are provided by cloud providers as SaaS from globally distributed data centers. Normally, this offers easy application deployment. However, it also brings new error sources that can affect application performance. For example, latency issues can lead to sluggish applications and even timeouts in those applications. With packet loss, similar behavior occurs, and retransmissions are visible.
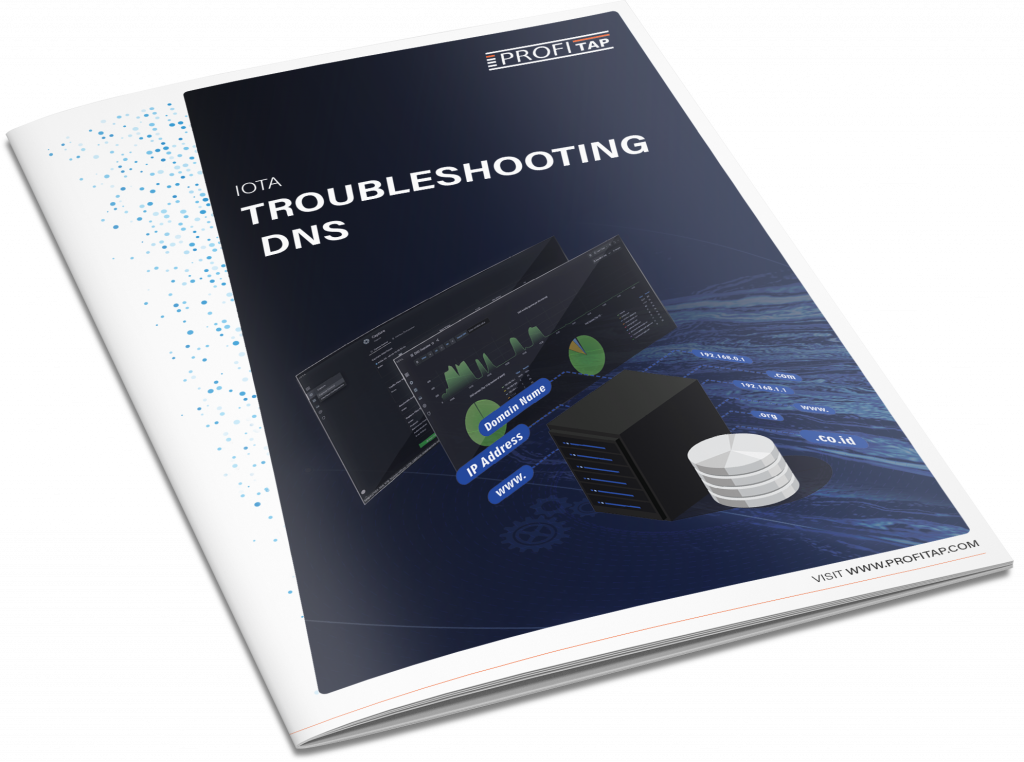
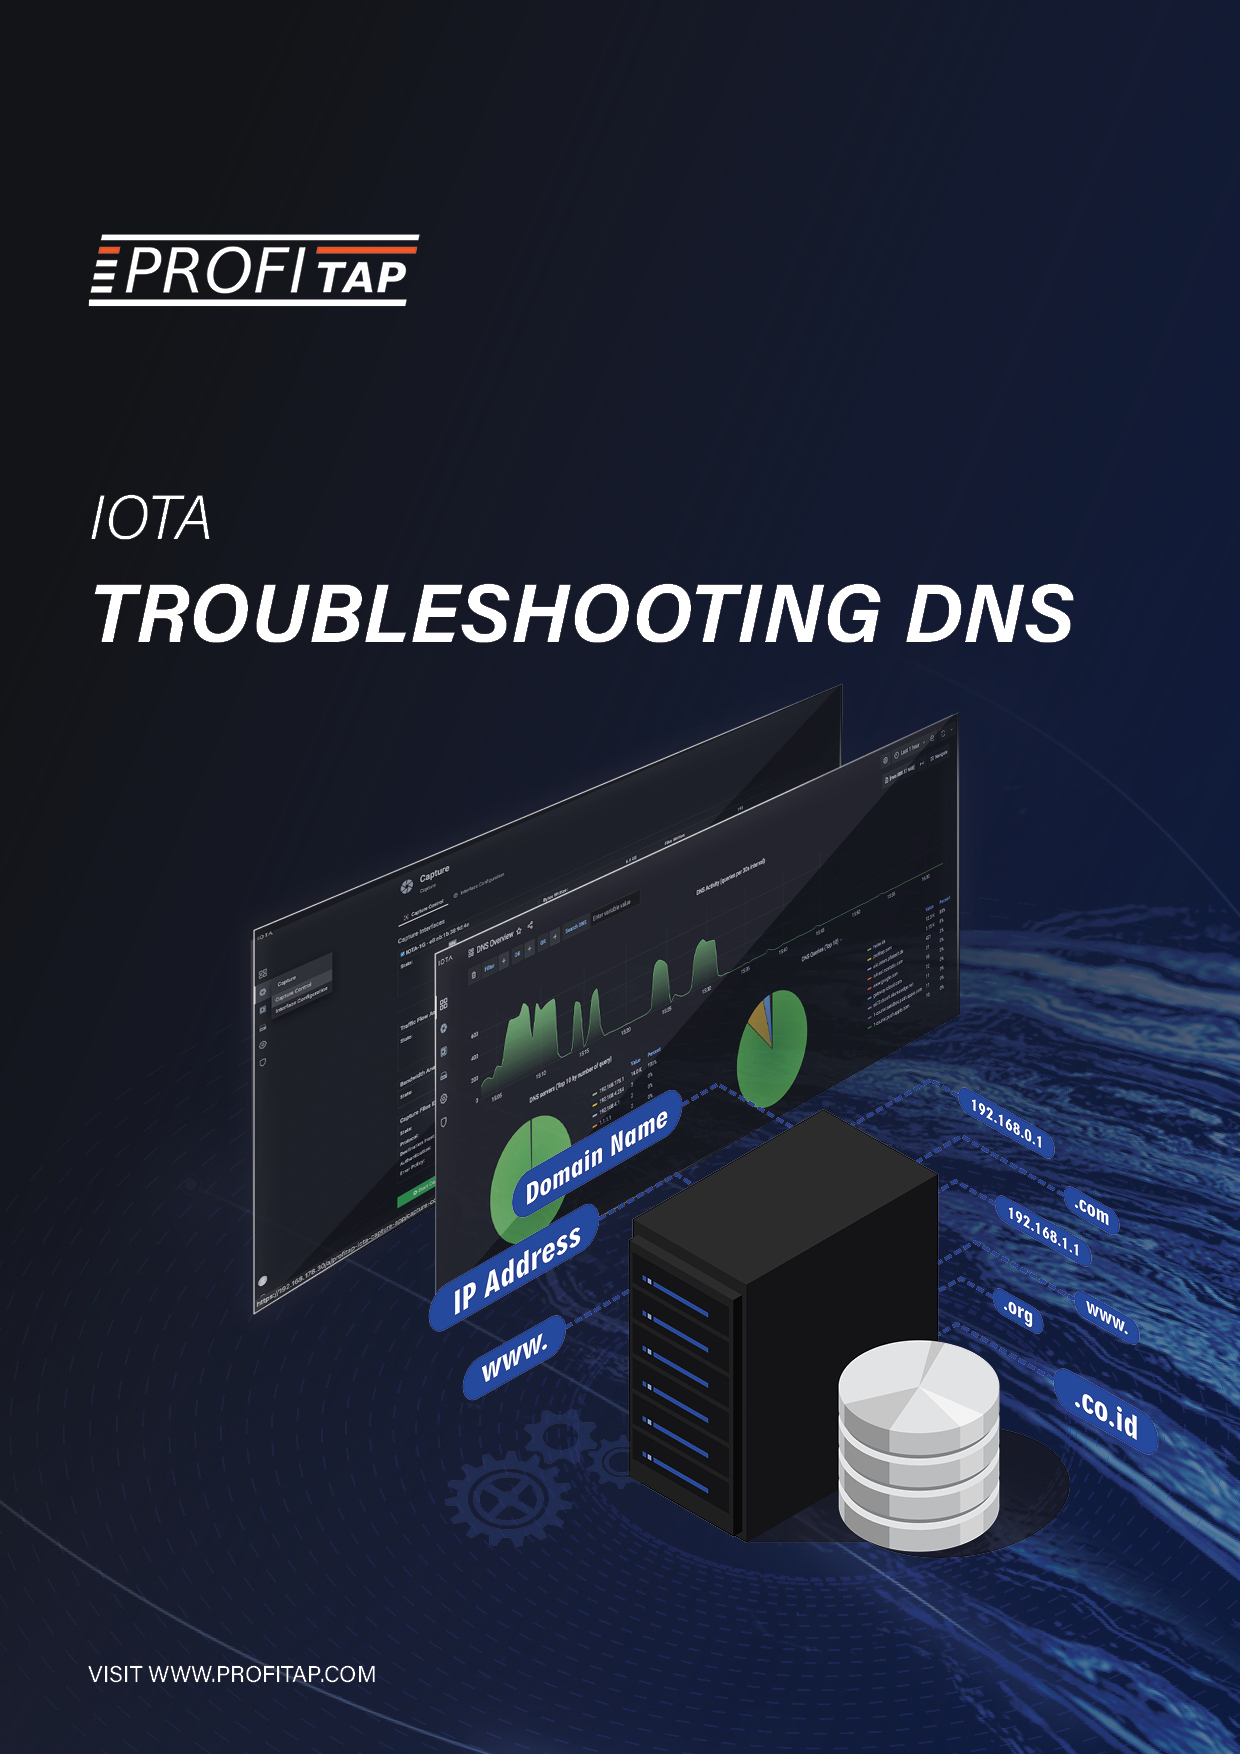
Troubleshooting DNS
There is a saying: “It’s not DNS. There is no way it’s DNS. It was DNS”. This makes it clear that DNS is an integral part of IT infra-structure services and can exhibit a wide variety of error patterns. For example, DNS can lead to applications not starting or starting with delays. Sometimes, this is due to incorrectly stored DNS records or performance bottlenecks on DNS servers. However, overly restrictive firewalls cause problems in some cases since some system integrators only support DNS over UDP. With large responses, however, DNS switches to TCP. Certificate errors in browsers can also indicate incorrect DNS entries.
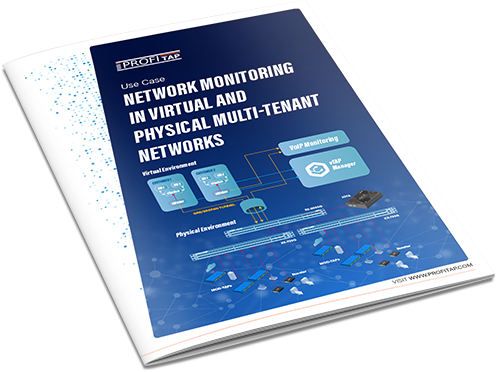
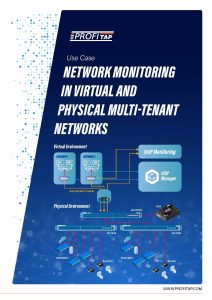
Network monitoring in virtual and physical multi-tenant networks
A multinational technology company specialized in cloud communications and workstream collaboration solutions with multiple global sites tasked Profitap to design a constant and permanently running network infrastructure solution for VoIP monitoring and general performance analysis.
Solving the challenges of packet capture
The first step in successful packet analysis for root cause troubleshooting is to capture the right packets. In this white paper, learn how the combination of tools from Profitap and NetAlly simplify getting access to the packet data.
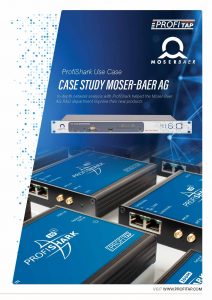
In-depth network analysis with ProfiShark helped the Moser-Baer AG improve their new products
An in-depth network analysis with ProfiShark that helped Moser Baer R&D department to improve their new products. ProfiShark helped Moser Baer debug and validate their outputs and verify sent/receive network traffic.
Quickly isolating cloud-based application issues
A use case of how IOTA was used to help users at a remote office location who experienced poor application performance with a cloud-hosted application.
White Papers
Timestamp Analysis and Three Efficient Ways to Run it with IOTA


In-Line tapping in the data center


ProfiShark performance results

Building a portable network forensics kit
The future of portability in network monitoring and packet capture

ProfiShark 1G use case analysis


Capturing in Time-Sensitive networking environments with ProfiShark