
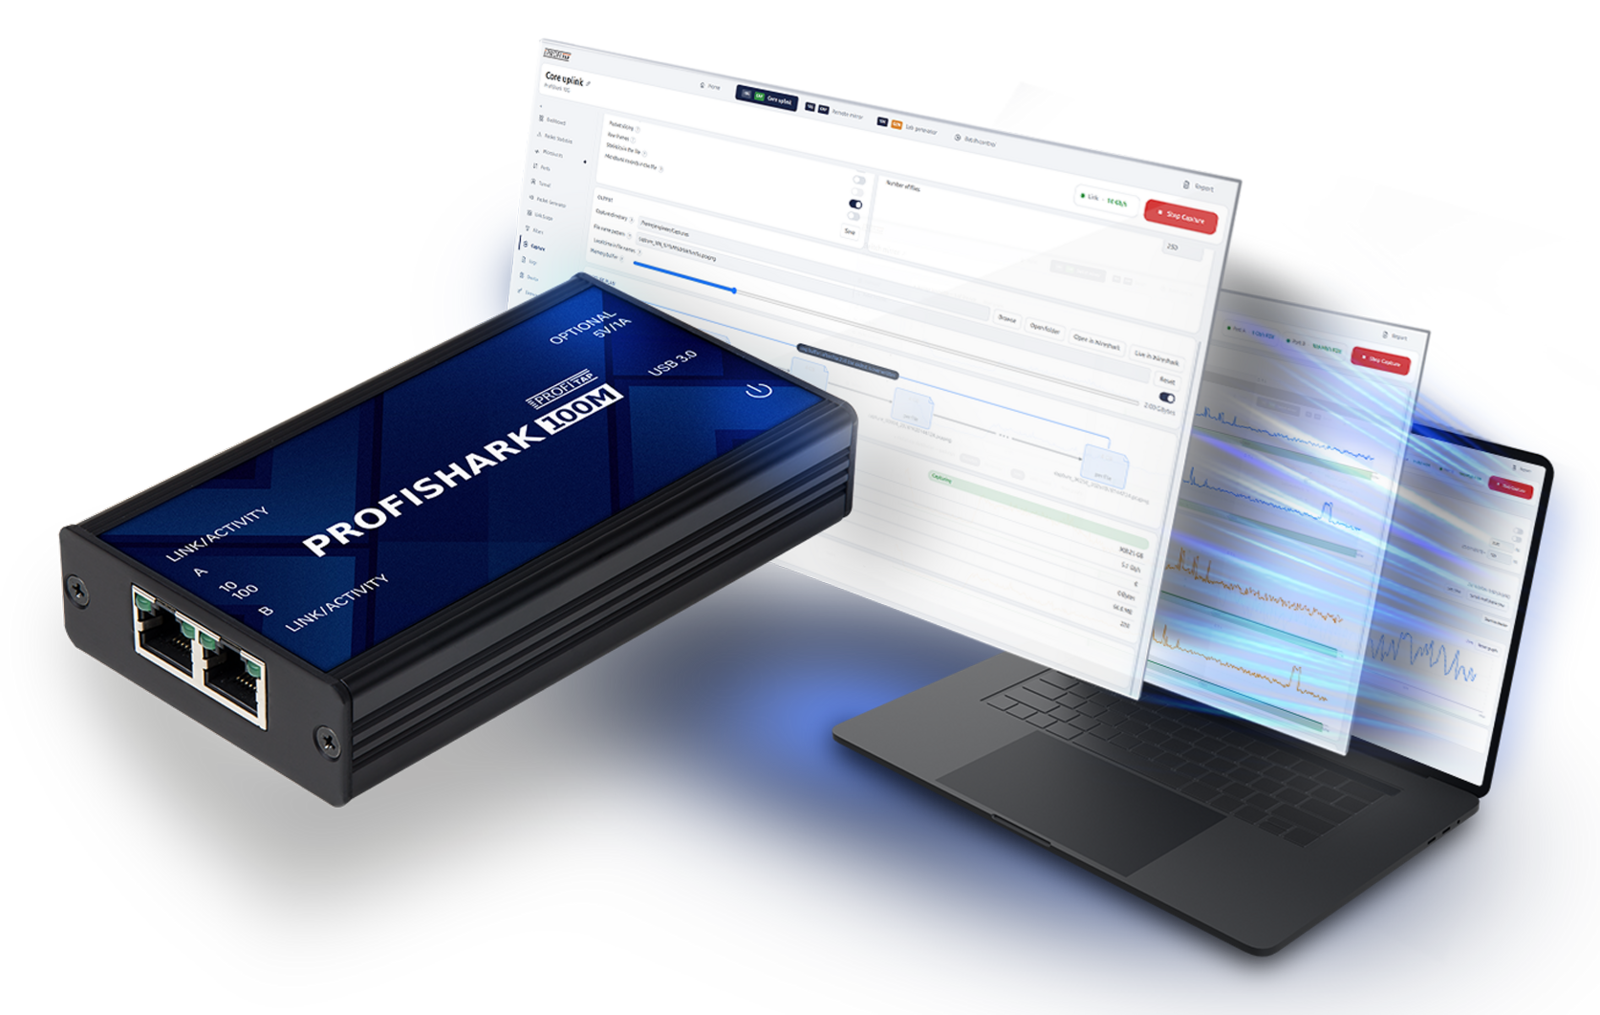
Reliable 10/100 Mb/s evidence from the wire
ProfiShark 100M is a compact, fully passive in-line capture device for regular Ethernet and Real-Time Industrial Ethernet. It captures full-duplex 10/100 Mb/s traffic at wirespeed, adds accurate hardware timestamps, and keeps the monitored network physically separated from the management interface.
Key benefits
- Full-duplex 10/100 Mb/s capture at wirespeed
- Fully passive, fail-safe in-line access with PoE passthrough
- 8 ns hardware timestamping at ingress
- Direct capture, Wireshark integration, and ProfiShark Manager reporting
In-line capture with zero impact on the network
Place ProfiShark 100M directly in the 10/100 Mb/s Ethernet link. The network path is fully passive and galvanically isolated from the capture system, while USB 3.0 connects the ProfiShark to the host for power, data capture, and ProfiShark Manager. Network traffic continues uninterrupted if the ProfiShark loses power.
ProfiShark 100M helps you
Capture accurately
Record full-duplex 10/100 Mb/s traffic directly from the network path, with 8 ns hardware timestamps and context-enriched capture files.
Diagnose the link
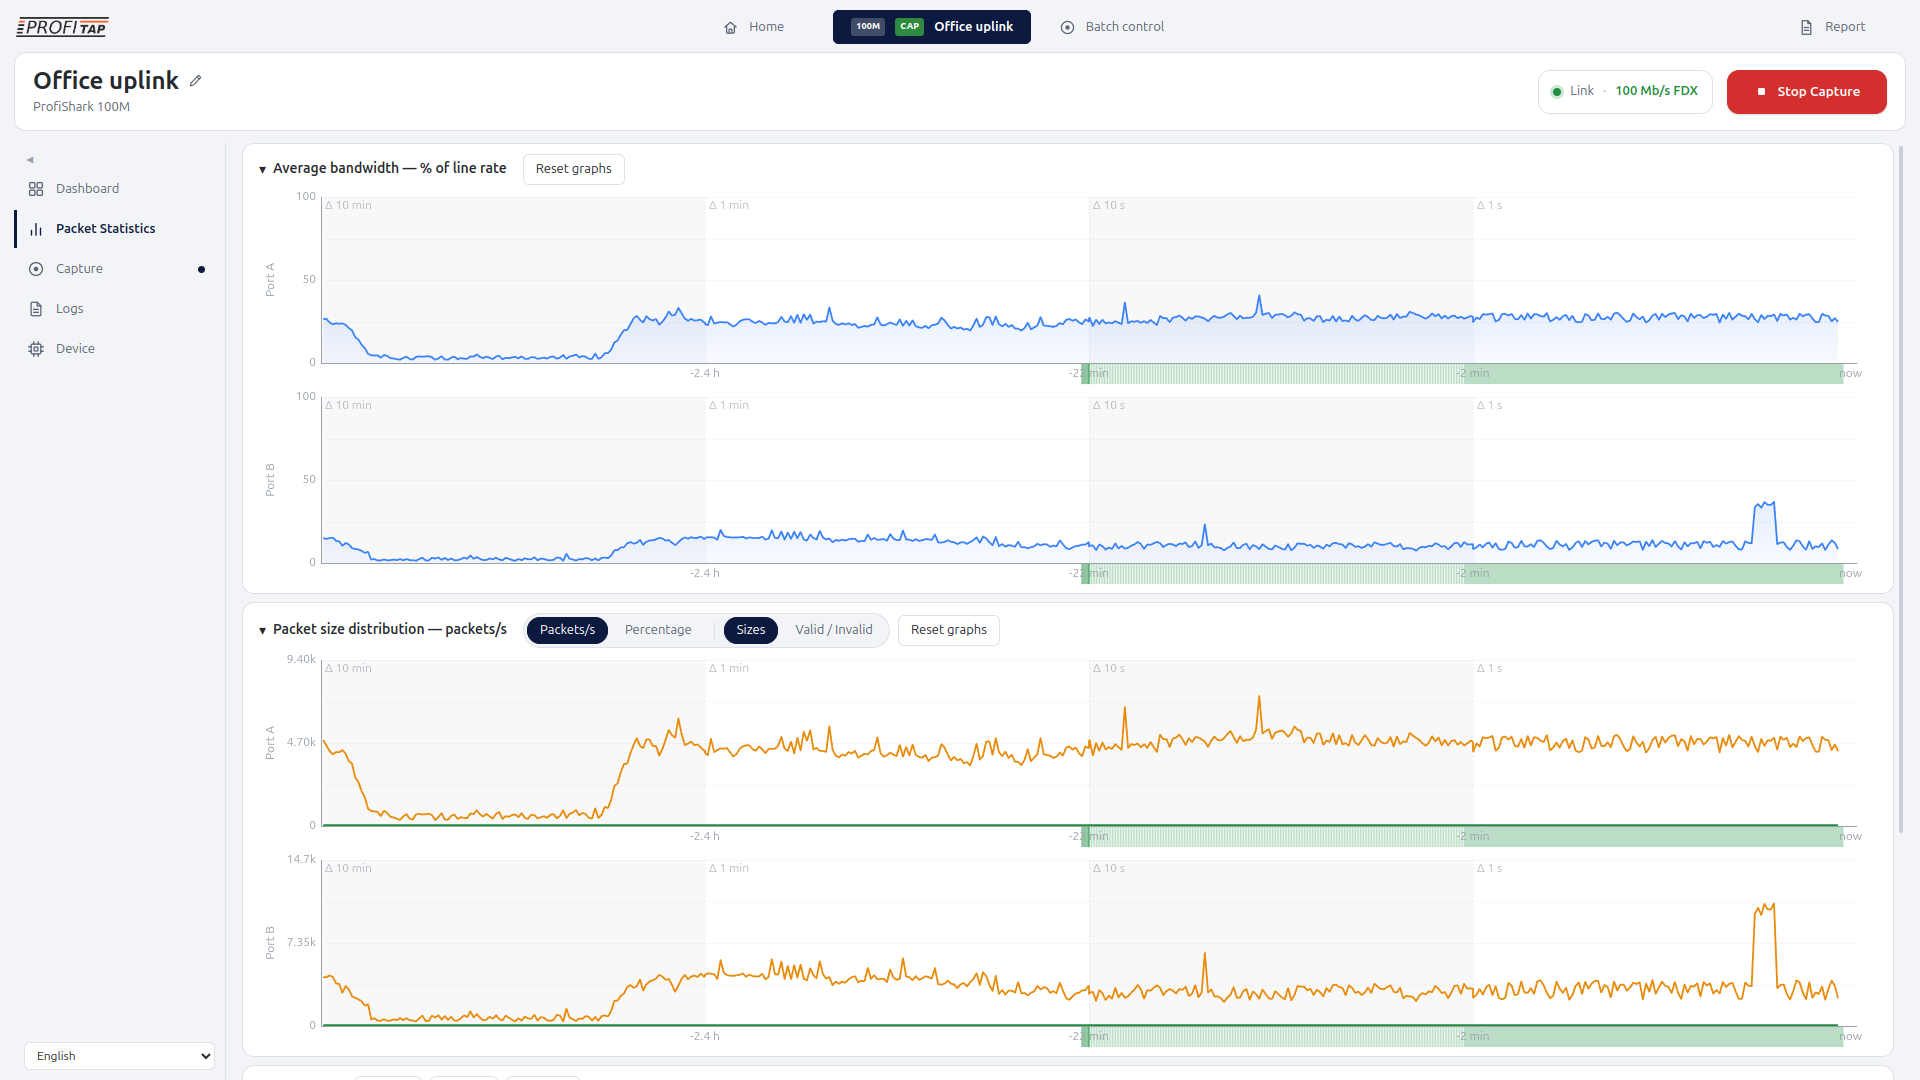
Use per-port traffic, bandwidth, packet drop, and CRC information to determine whether low-level errors or link behavior contributed to the incident.
Validate the result
Repeat the capture after a change or repair, and compare packet-level evidence and counters to confirm that network behavior has improved.
Report the findings
Create a PDF or web report from ProfiShark Manager so the available measurements, tables, and charts can be shared as a consistent troubleshooting record.
Capture industrial Ethernet with confidence
ProfiShark 100M is designed for both standard Ethernet and Real-Time Industrial Ethernet. It captures packets of all sizes and types without relying on a general-purpose NIC, while accurate hardware timestamping supports timing-sensitive packet analysis.
Captures can be written directly to disk or opened in Wireshark or another compatible analyzer. Context-enriched capture files can retain useful device, link, clock, filter, and per-port context alongside the packet data.
Keep the network path passive and fail-safe
The monitored link is physically isolated from the management interface. PoE passes through the device, and because the in-line network path is passive, traffic continues uninterrupted even if power is removed.
One workflow in ProfiShark Manager
ProfiShark Manager brings the 100M capture and diagnostic workflow together on Windows, Linux, and macOS.
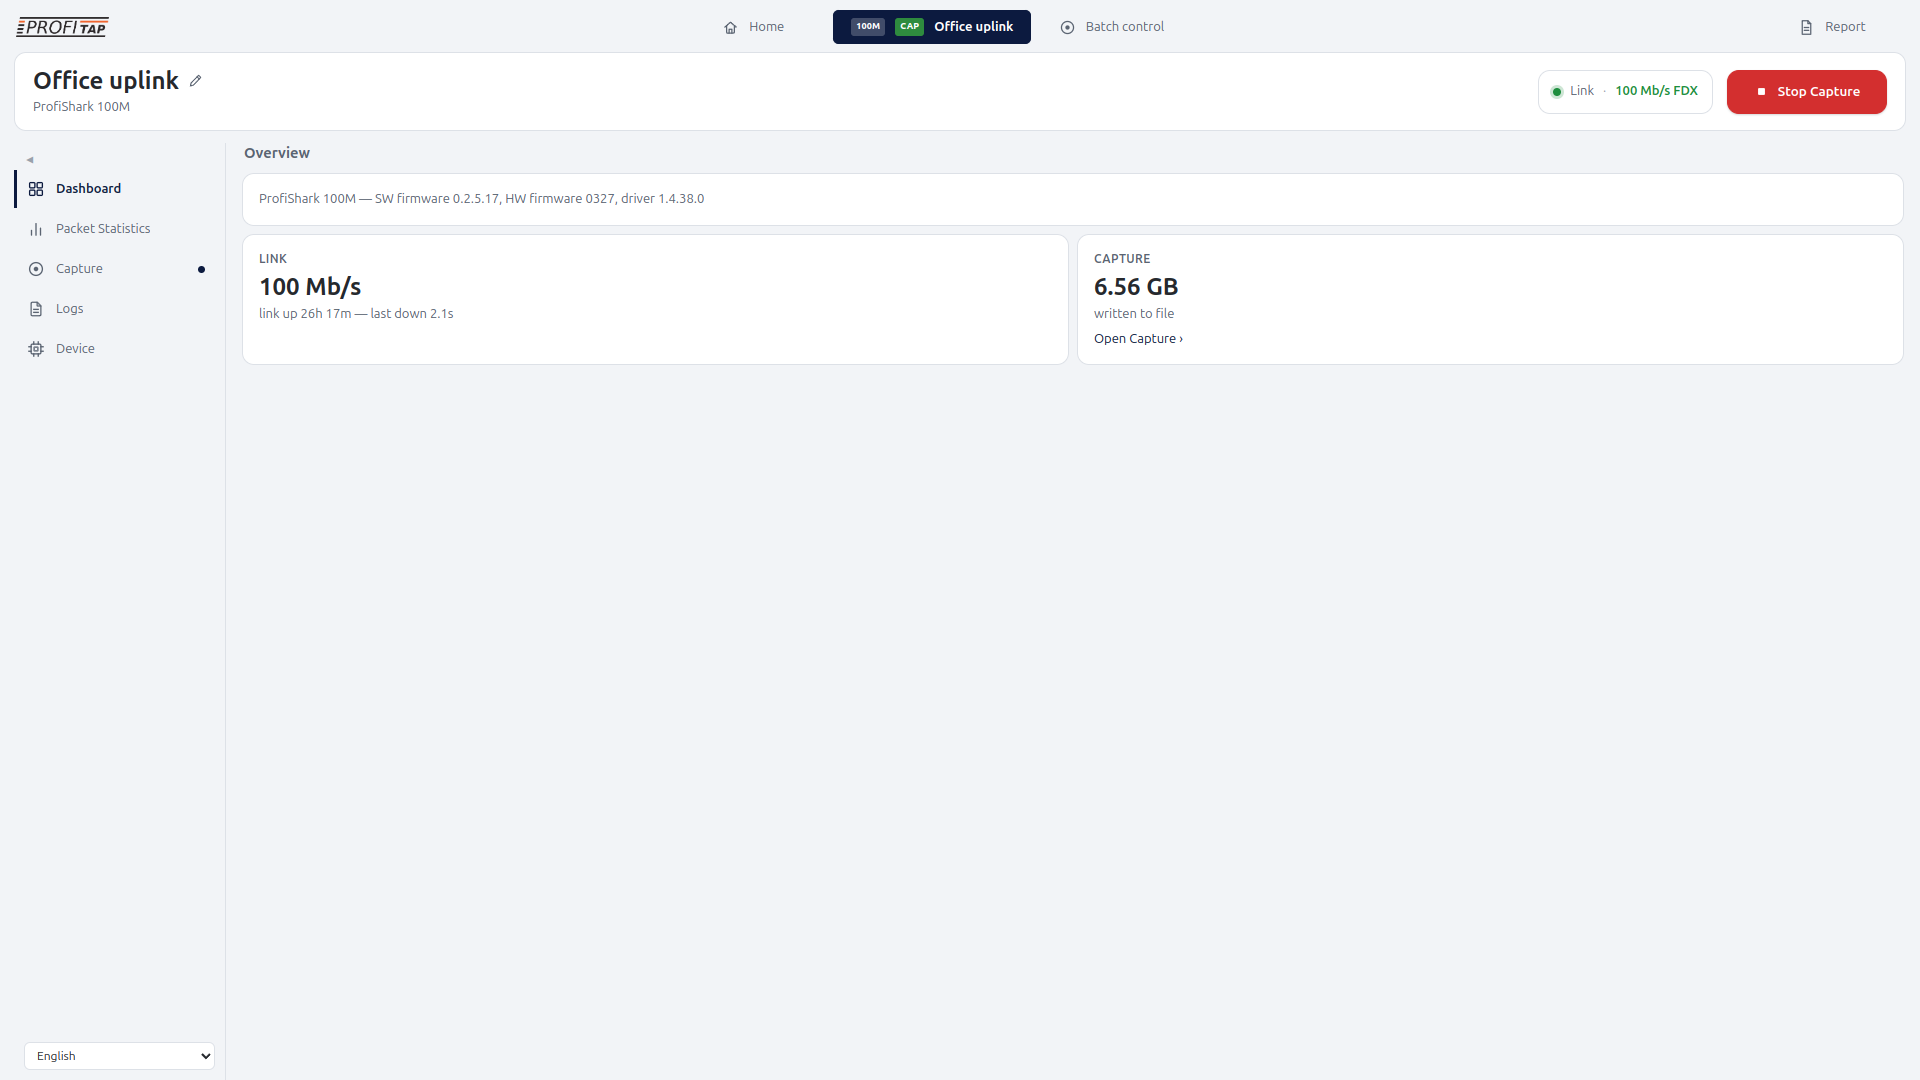
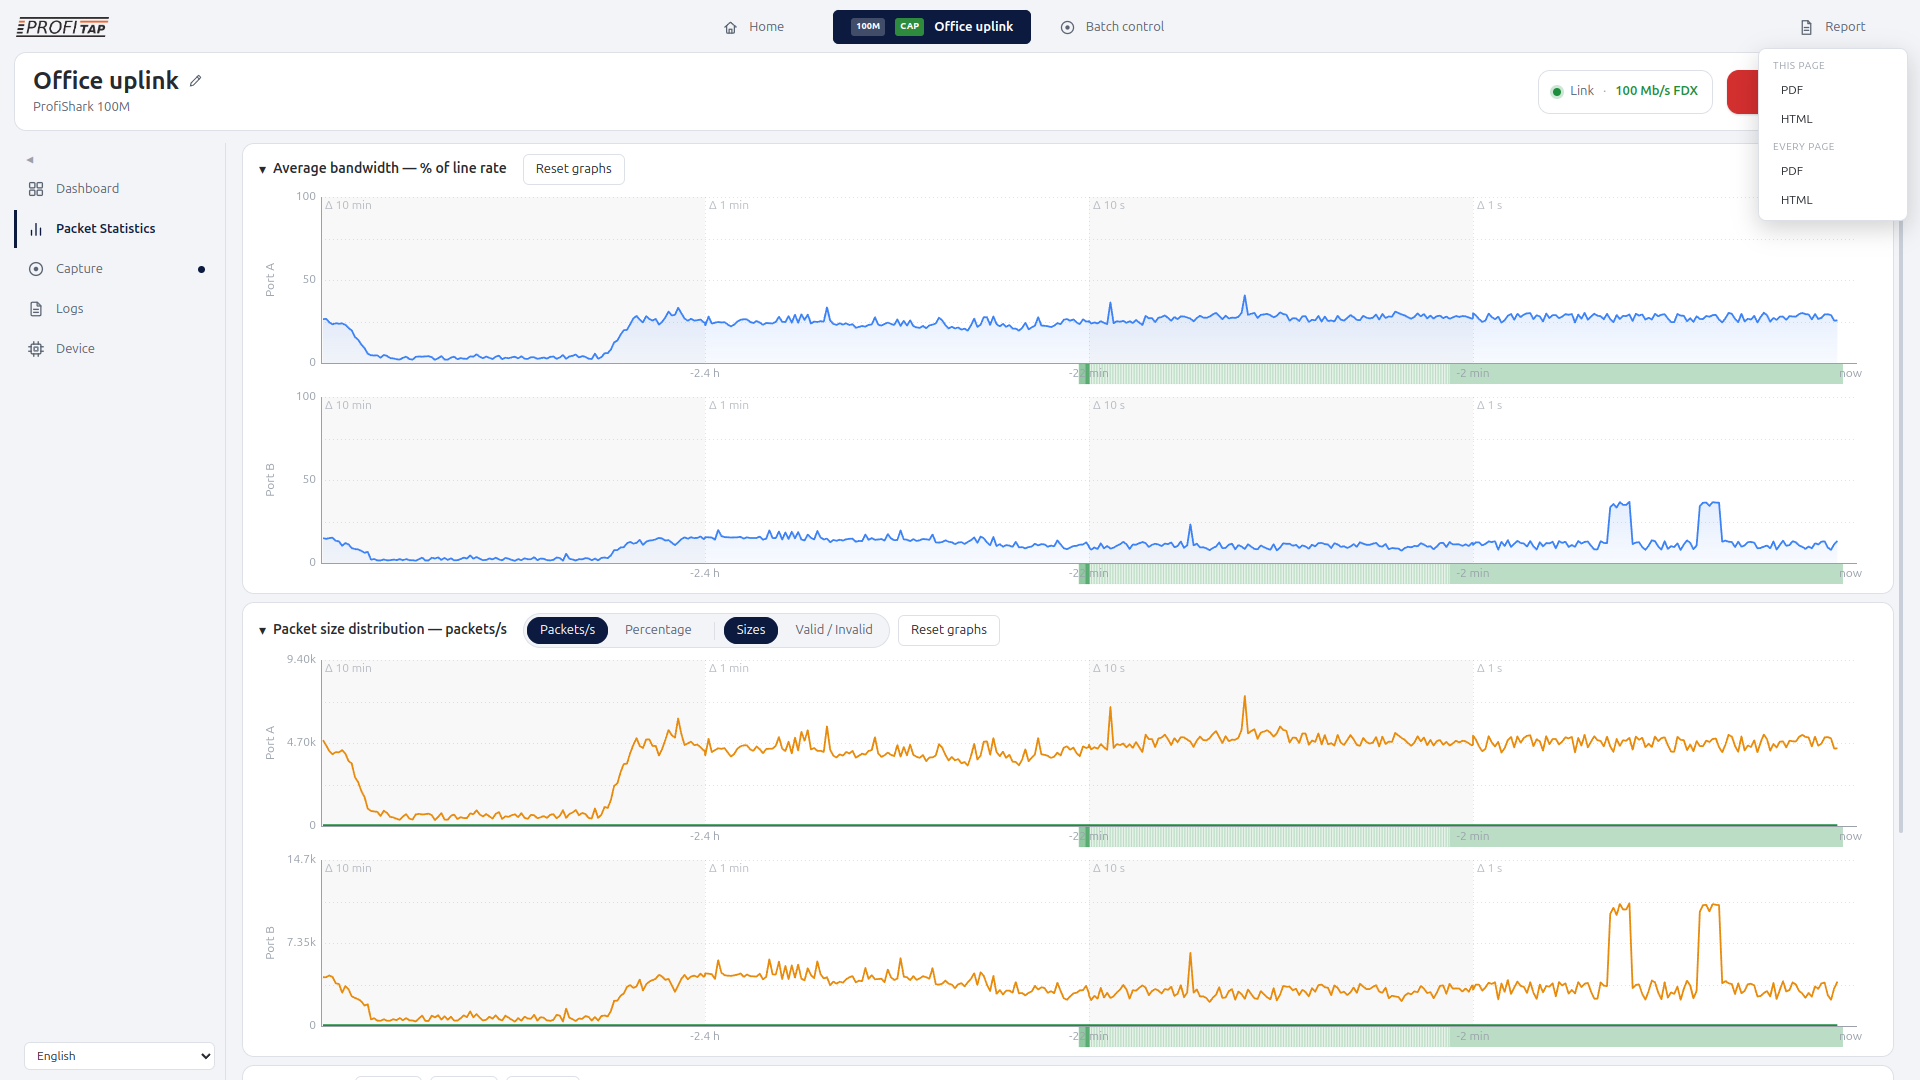
Overview Dashboard
See link state, traffic, capture status, and device health at a glance.
Packet Statistics
Review packet counts, bandwidth, CRC errors, and recent or historical measurements.
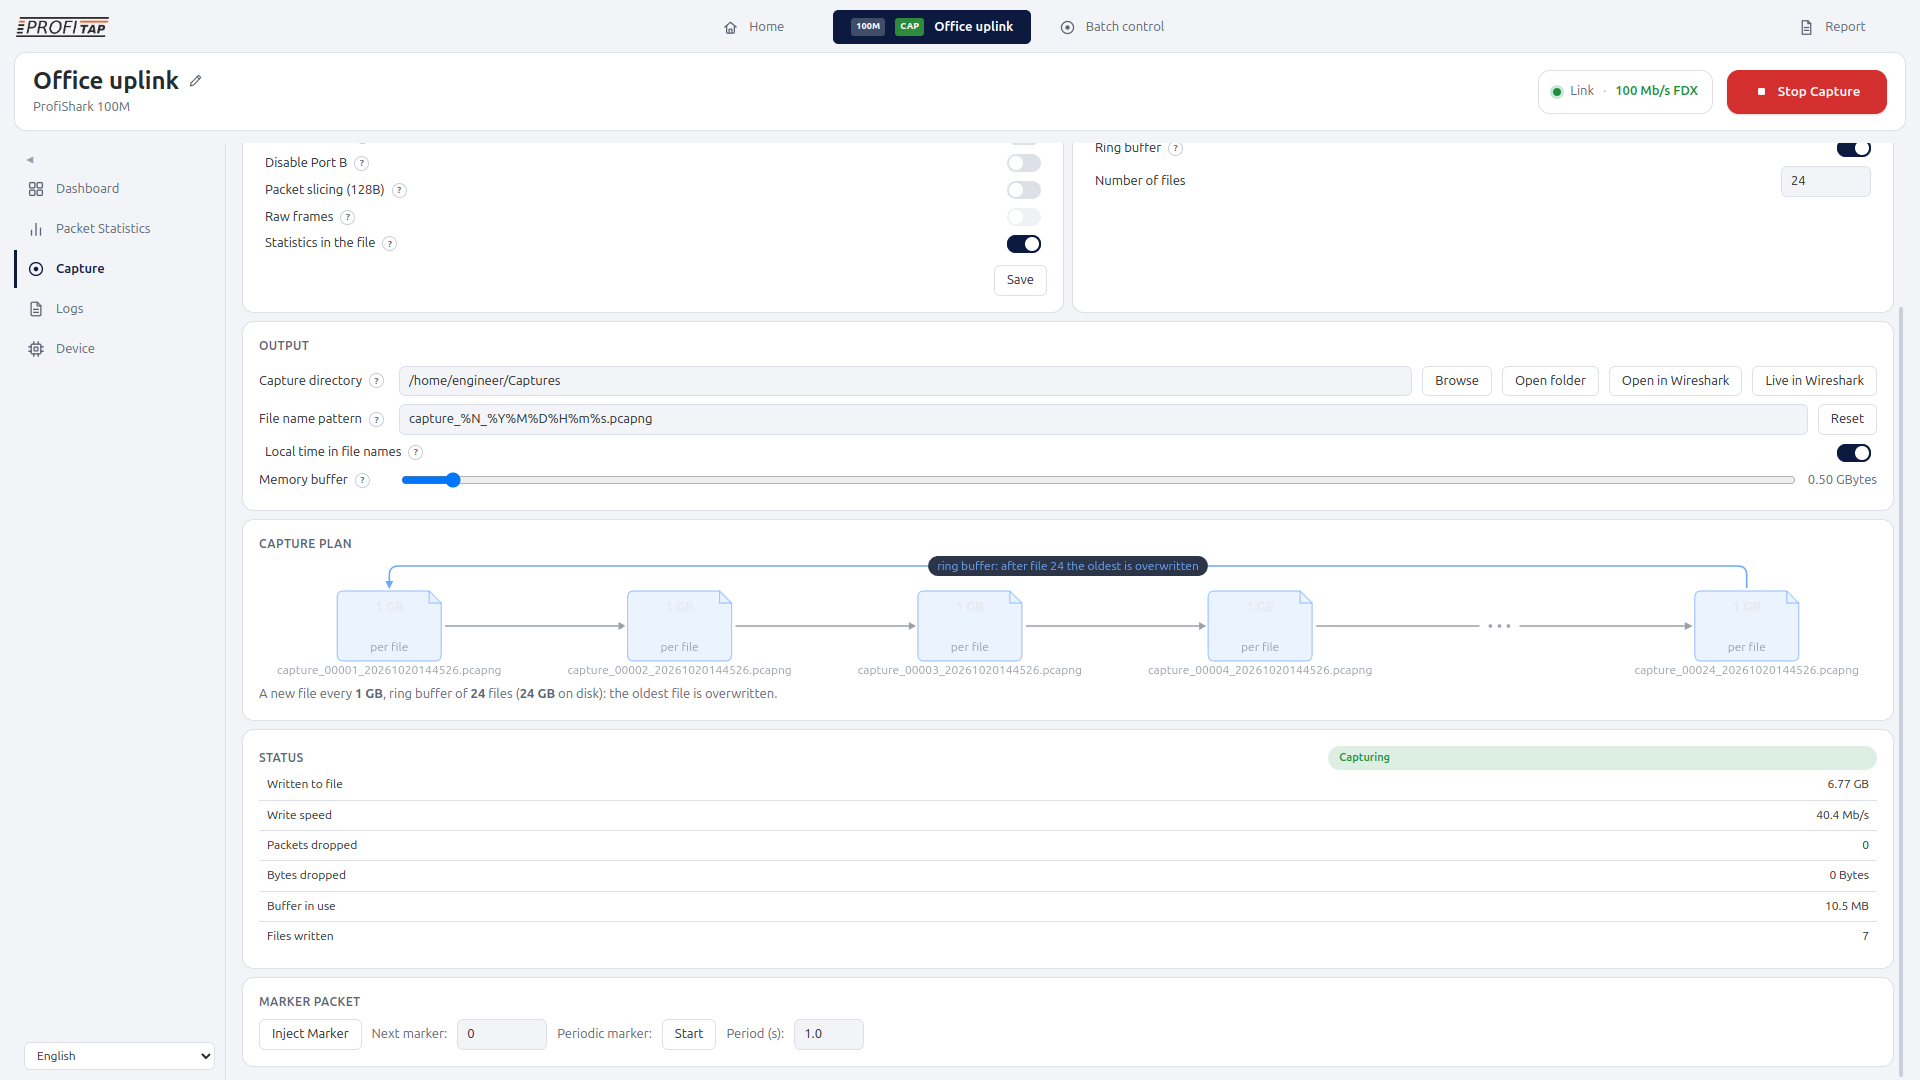
Capture
Configure direct capture, file size or duration, rotation, and retention behavior.
Reporting
Create a PDF or web report from an individual diagnostic page or from the available investigation pages.
Typical applications
Industrial and legacy Fast Ethernet troubleshooting
Capture reliable packet evidence directly from 10/100 Mb/s links when diagnosing communication problems in legacy, industrial, or embedded Ethernet environments.
Real-Time Industrial Ethernet packet capture
Record timing-sensitive industrial Ethernet traffic with accurate hardware timestamps for detailed packet analysis without relying on a general-purpose network interface.
Intermittent communication issues and long-term capture
Run extended captures to preserve packet evidence around faults that occur unpredictably, using file rotation and ring-buffer capture where required.
Field service on 10/100 Mb/s networks
Bring portable, purpose-built capture directly to the network link to investigate field issues without adding an addressable device to the monitored segment.
Packet forensics and protocol analysis in Wireshark
Capture packets at the wire and continue detailed protocol investigation in Wireshark or another compatible analyzer using reliable, timestamped evidence.
Evidence handover to vendors, support teams, or colleagues
Share enriched packet captures and ProfiShark Manager reports so others receive packet evidence together with useful device, link, and measurement context.
Specifications
| Network technology | 10/100 Mb/s Ethernet |
|---|---|
| Network ports | 2 x RJ45 8-pin |
| Monitoring mode | In-line |
| Network behavior | Fully passive, galvanically separated network path, invisible to the network |
| PoE | 802.3af / VoIP compliant PoE passthrough |
| Capture performance | Full-duplex 100 Mb/s wirespeed capture, 3.2 Mpps |
| Capture format | pcapng |
| Capture context | Device, interface, timing, capture settings, and per-port statistics are embedded alongside packet data |
| Capture modes | Live capture, direct capture to disk, long-term capture/ring buffer |
| Timestamping | 8 ns hardware timestamp at ingress |
| Packet slicing | Yes, available as a capture option (128 bytes) |
| Port monitoring | Real-time statistics, low-level error and bandwidth monitoring, per-port drop, and CRC counters |
| Host connection | USB 3.0 |
| Optional power input | 5 VDC |
| Network latency | 2 ns |
| Dimensions (WxDxH) | 69 x 124 x 24 mm / 2.72 x 4.88 x 0.94 in |
| Weight | 176 g / 0.39 lb |
| Software | ProfiShark Manager, Wireshark integration, CLI, reporting |
| Operating systems | Windows, Linux, macOS |
| System requirements | Dual Core processor, 4 GB memory, USB 3.0 port |
| Included accessories | USB 3.0 cable (1.8 m), Ethernet Cat6a cable (2 m), transport pouch |
| Compliance | RoHS, CE, UKCA, EAC, EN 45545-2 |
| Order reference | C1AP-100 |
Thank you!
Your submission has been sent. If you want more information, solutions, and use cases, check out the links below:Did You Know?

FAQ
Where can I download ProfiShark software, drivers, and firmware?
ProfiShark Manager (includes drivers and firmware) for Windows and macOS is available from the ProfiShark software repository.
For Linux, ProfiShark Manager (.deb) and drivers are available from the Profitap APT repository. ProfiShark Manager (Flatpak) is also available from the ProfiShark software repository. The Linux setup instructions list the supported distributions and installation steps.
The ProfiShark Manager User Guide is available on our Knowledge Base.
What is ProfiShark 100M?
A purpose-built packet capture and troubleshooting device for 10/100 Mb/s Ethernet, with a fully passive in-line path and hardware timestamping.
Is ProfiShark 100M fail-safe?
Yes. The in-line network path is fully passive, so network traffic continues if the ProfiShark loses power, with zero failover time.
Does it pass PoE?
Yes. ProfiShark 100M supports PoE passthrough.
What timestamp resolution does it provide?
ProfiShark 100M provides 8 ns hardware timestamping at ingress.
Can I use it with Wireshark?
Yes. Captures can be analyzed in Wireshark or another compatible packet analyzer, and ProfiShark Manager provides Wireshark integration.
Can it be used for long-term capture?
Yes. Long-term capture supports normal or ring-buffer modes, file splitting by time or size. Intel-based Synology NAS storage is supported in ProfiShark Manager 3.2 on macOS, 3.3 on Linux and 1.9.7 on Windows, and will soon be available in ProfiShark Manager v5.
Can ProfiShark Manager create reports for 100M?
Yes. Reporting is a ProfiShark Manager capability and is available for this model; the report contains the diagnostic pages and measurements available to the connected device.
Which operating systems are supported?
ProfiShark Manager is available on Windows, Linux, and macOS.
Related products
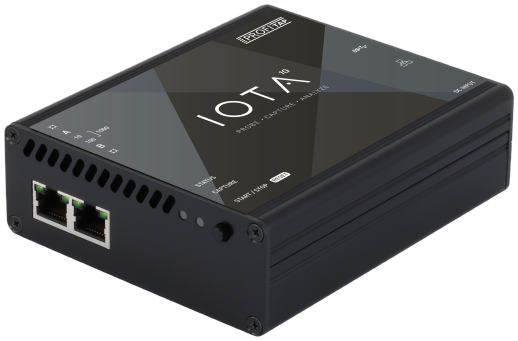
IOTA 1G
A multifunctional passive network probe with integrated traffic capture and analysis capabilities.
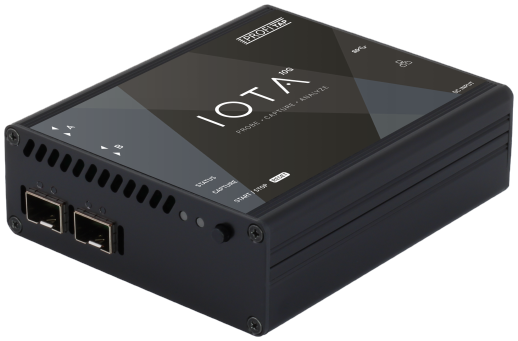
IOTA 10G
A multifunctional passive network probe with integrated traffic capture and analysis capabilities.
ProfiShark 1G
Portable 10/100/1000 Mb/s capture with in-line/out-of-band deployment, link diagnostics, and packet generation.