
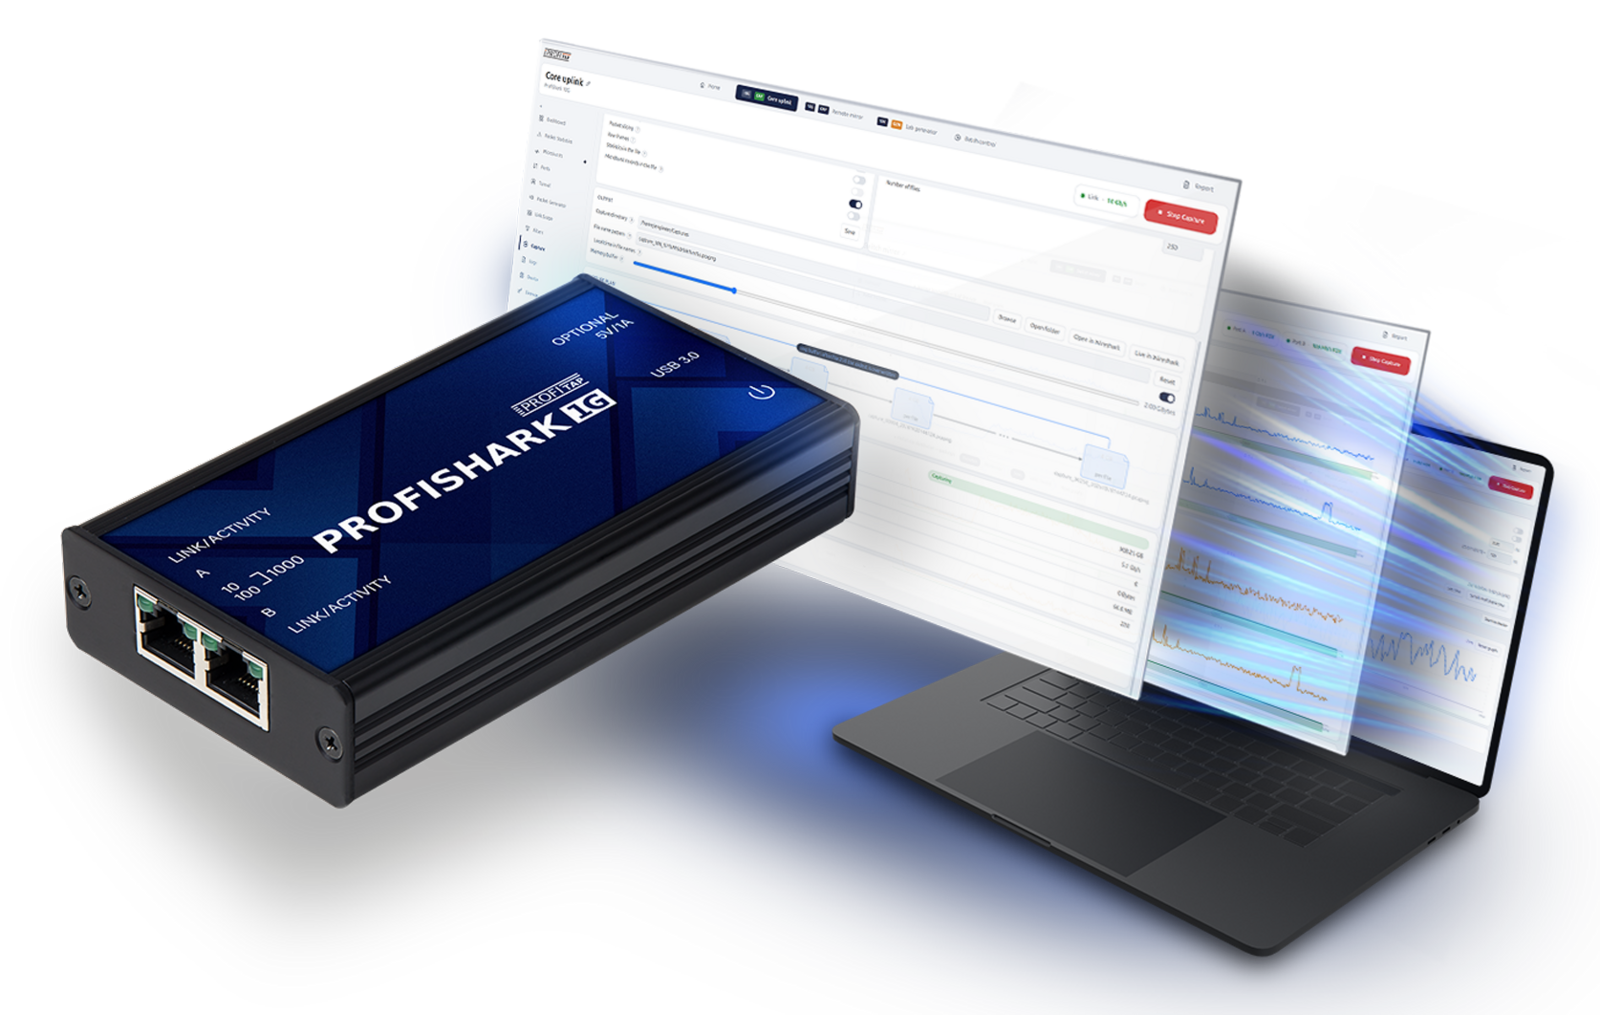
Capture, diagnose, and validate 10/100/1000 Mb/s Ethernet
ProfiShark 1G combines full-duplex Gigabit packet capture with practical copper-link diagnostics in a portable field tool. Capture directly in-line or from mirrored traffic, timestamp packets in hardware, diagnose cabling and EEE behavior, and use packet generation to validate the connection.
Key benefits
- Full-duplex 1G capture at wirespeed with 8 ns timestamps
- Fail-safe in-line access with PoE passthrough, plus SPAN capture
- Live cable diagnostics, wiring information, and EEE reporting/control
- Packet generation for controlled link validation
In-line and SPAN capture for Gigabit Ethernet
Deploy ProfiShark 1G in-line between two Ethernet endpoints for direct visibility into the live link, or use the two capture ports as independent inputs for SPAN/mirrored traffic. USB 3.0 connects the ProfiShark to the host running ProfiShark Manager for power, data transfer, configuration, capture, and diagnostics.
ProfiShark 1G helps you
Capture accurately
Capture 10/100/1000 Mb/s traffic with 8 ns hardware timestamps, per-port counters, and ProfiShark custom block in the capture file, describing packet statistics and capture status.
Diagnose the link
Check cable length or fault distance, pair wiring, signal quality, negotiated role, link-partner information, and Energy Efficient Ethernet behavior while the link remains in service.
Validate the connection
Use packet generation with configurable frame length, rate, and packet count, then compare the transmitted and received results, including CRC error readouts.
Report the findings
Generate a PDF or web report from ProfiShark Manager to hand over the measurements, charts, and results from the investigation.
Lossless Gigabit traffic capture
ProfiShark 1G captures packets of all sizes and types, preserving tags and encapsulations for analysis. Full-duplex Gigabit traffic is captured, timestamped, aggregated, and sent to the host over USB 3.0.
Use direct capture to disk for reliable high-performance recording, or work with Wireshark and other compatible analyzers for live protocol analysis.
Diagnose copper cabling while the link stays up
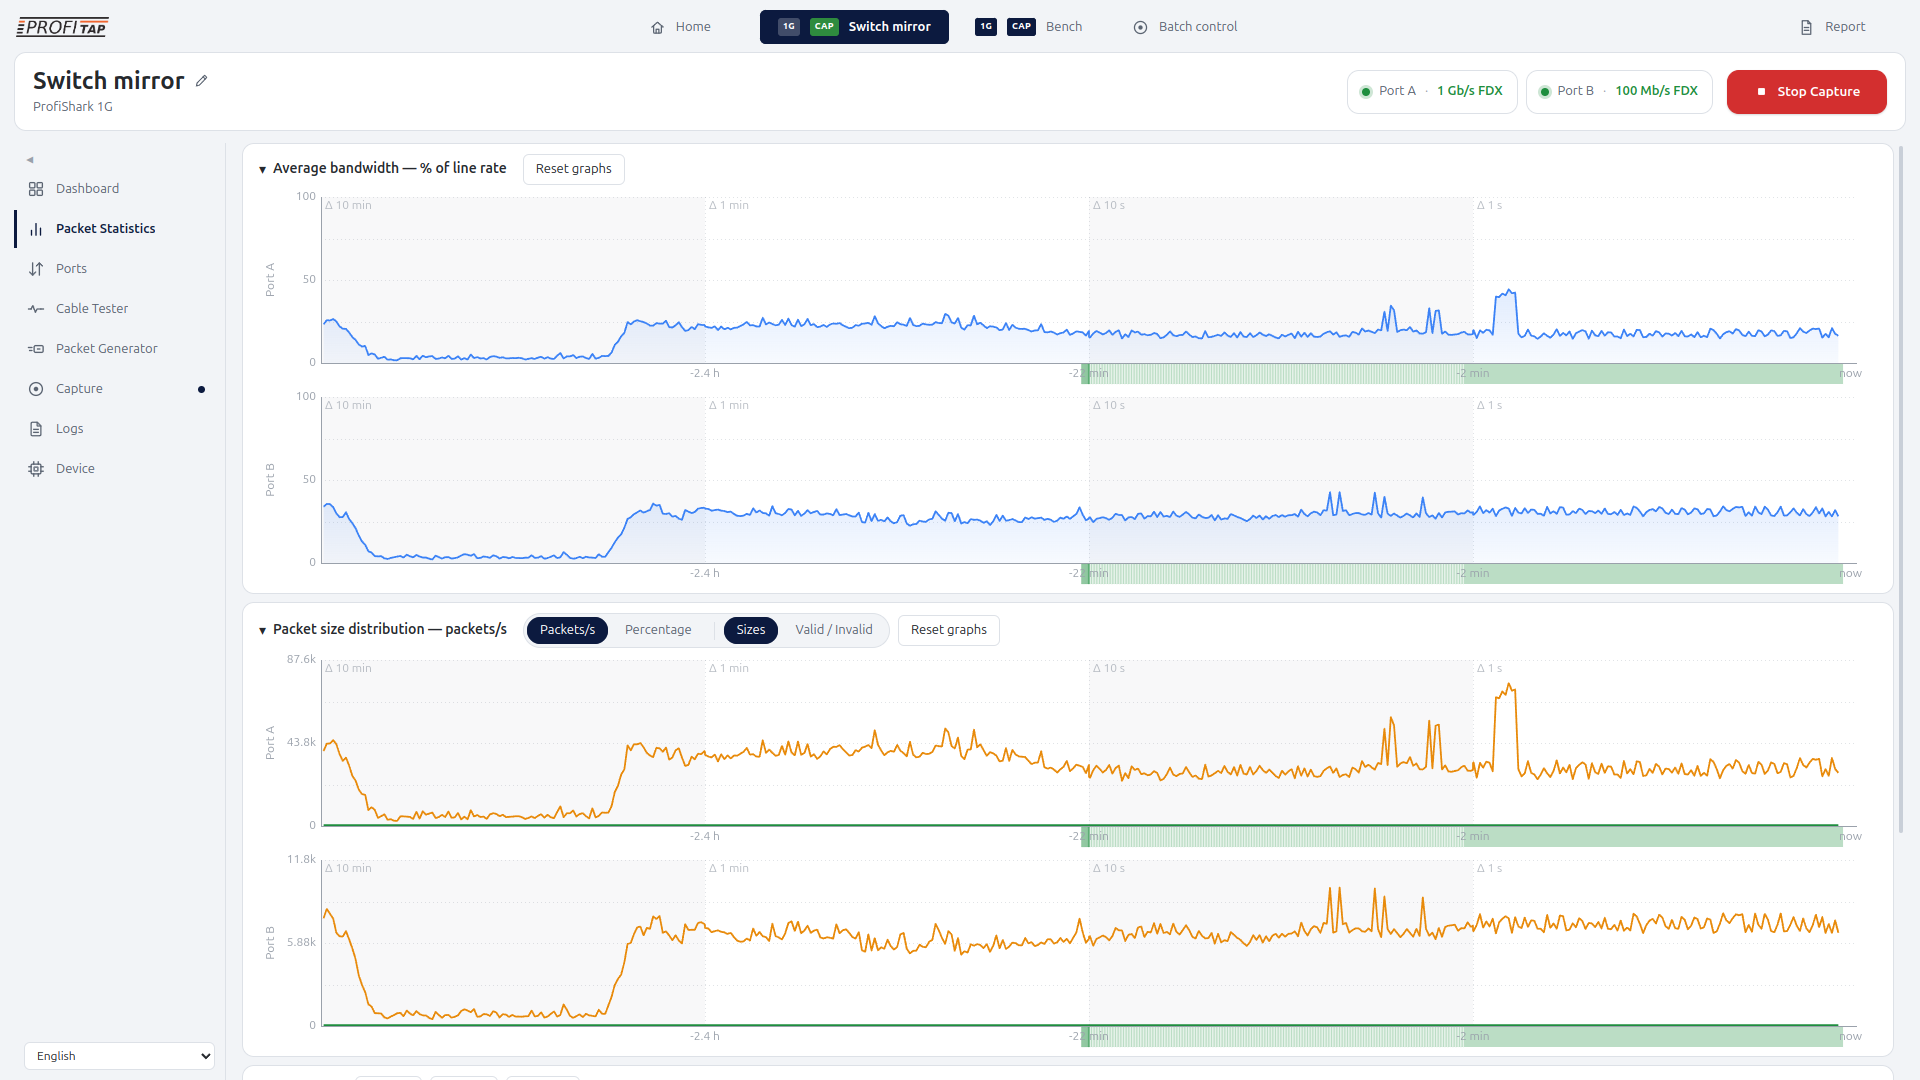
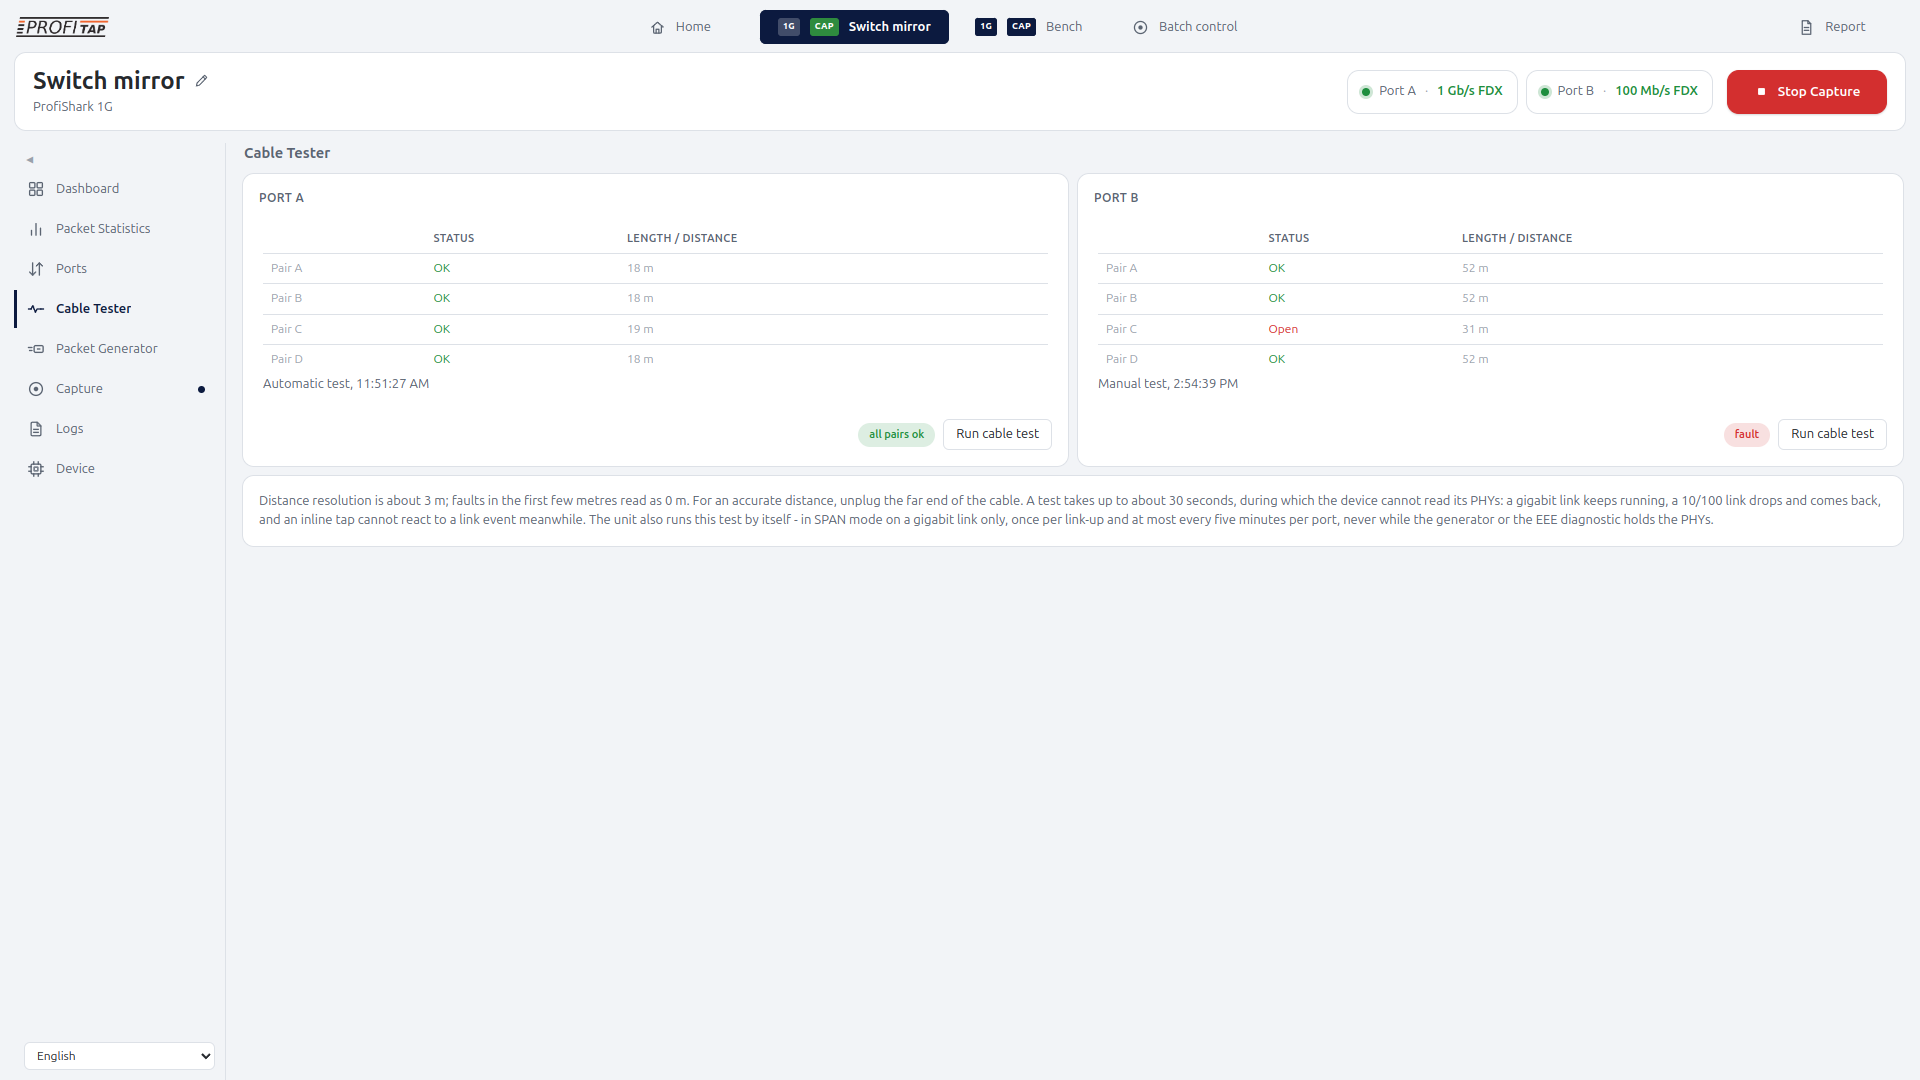
The built-in cable diagnostics can measure the length of each pair or the distance to a fault, report pair wiring, the resolved master/slave role, what the link partner advertises, and a signal-quality value. The test runs without taking the monitored link out of service.
ProfiShark 1G also reports Energy Efficient Ethernet behavior and lets the engineer control the advertisement, making it faster to rule EEE in or out during latency, packet-loss, or intermittent-link investigations.
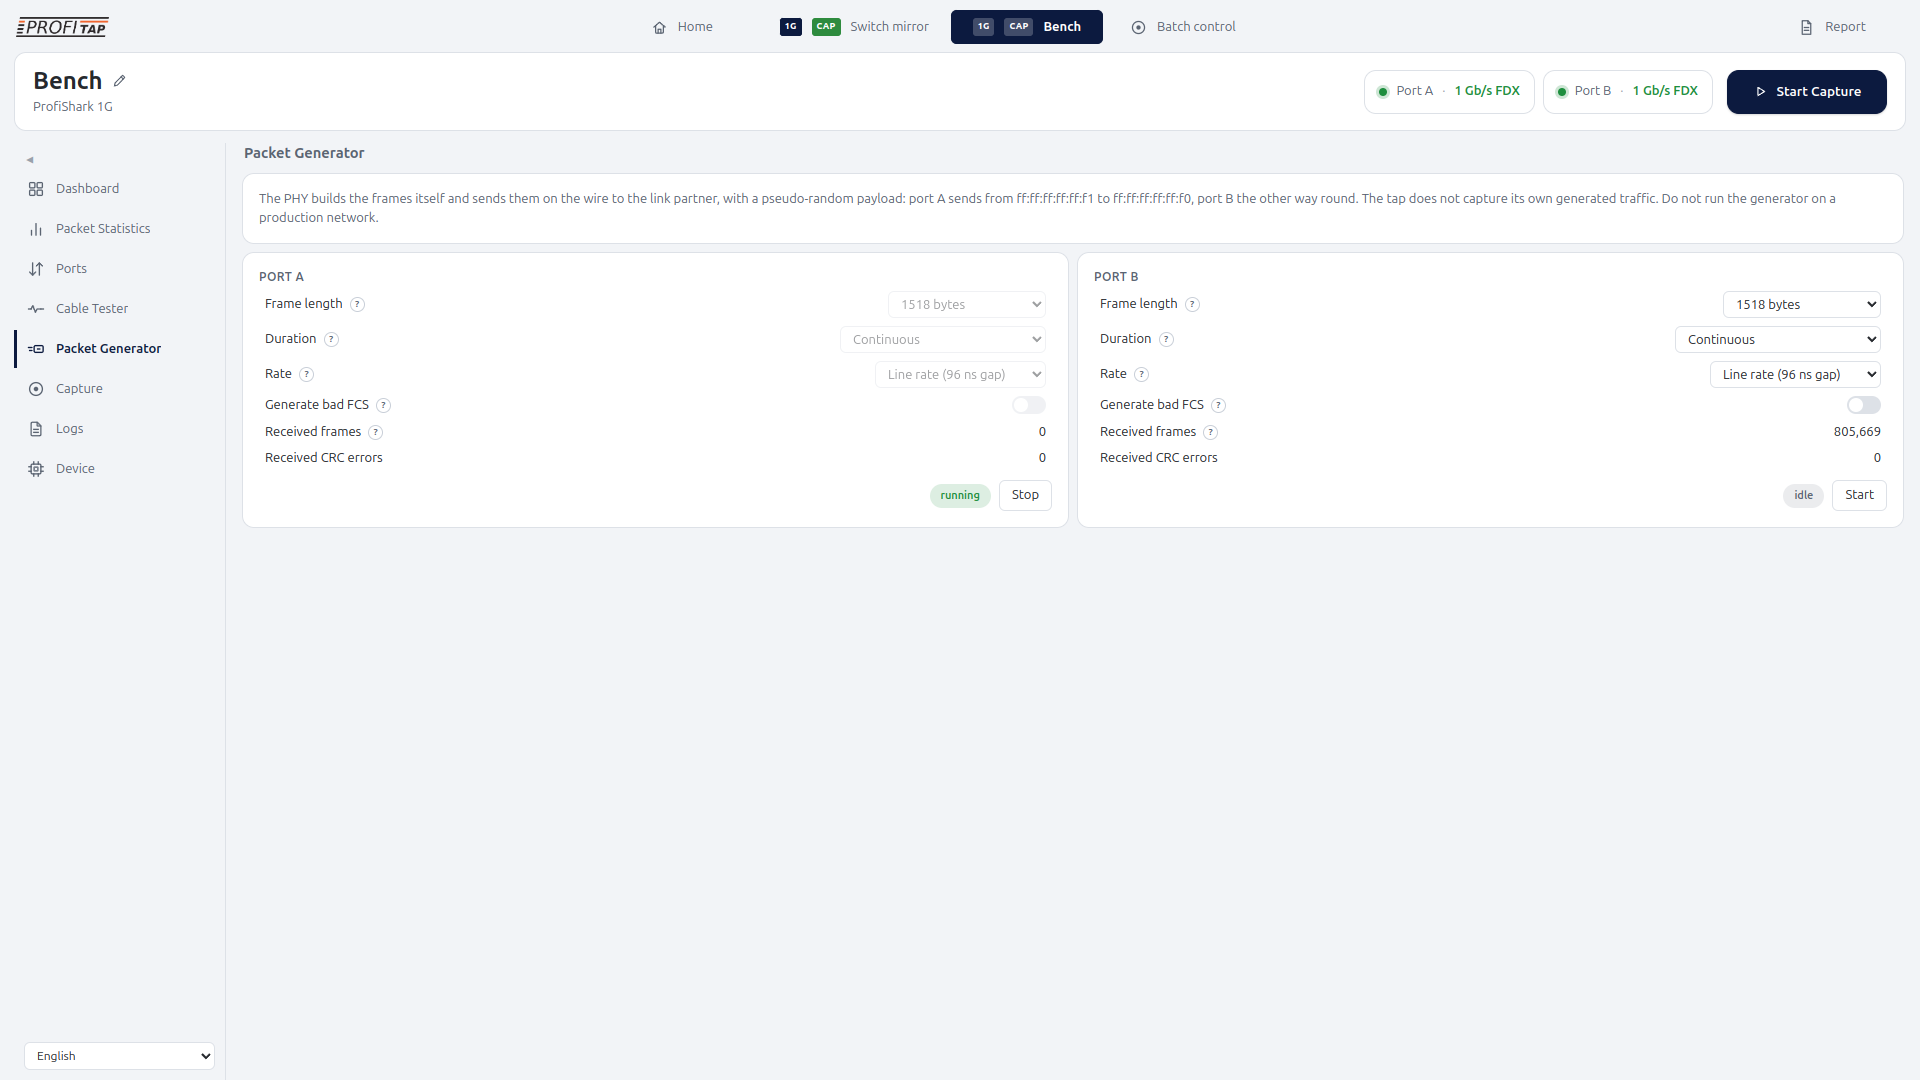
Validate with packet generation
Packet generation turns the ProfiShark into a controlled link tester. Set frame length, transmission rate, and packet count, then review transmitted and received packet counts and CRC-error results to confirm link behavior.
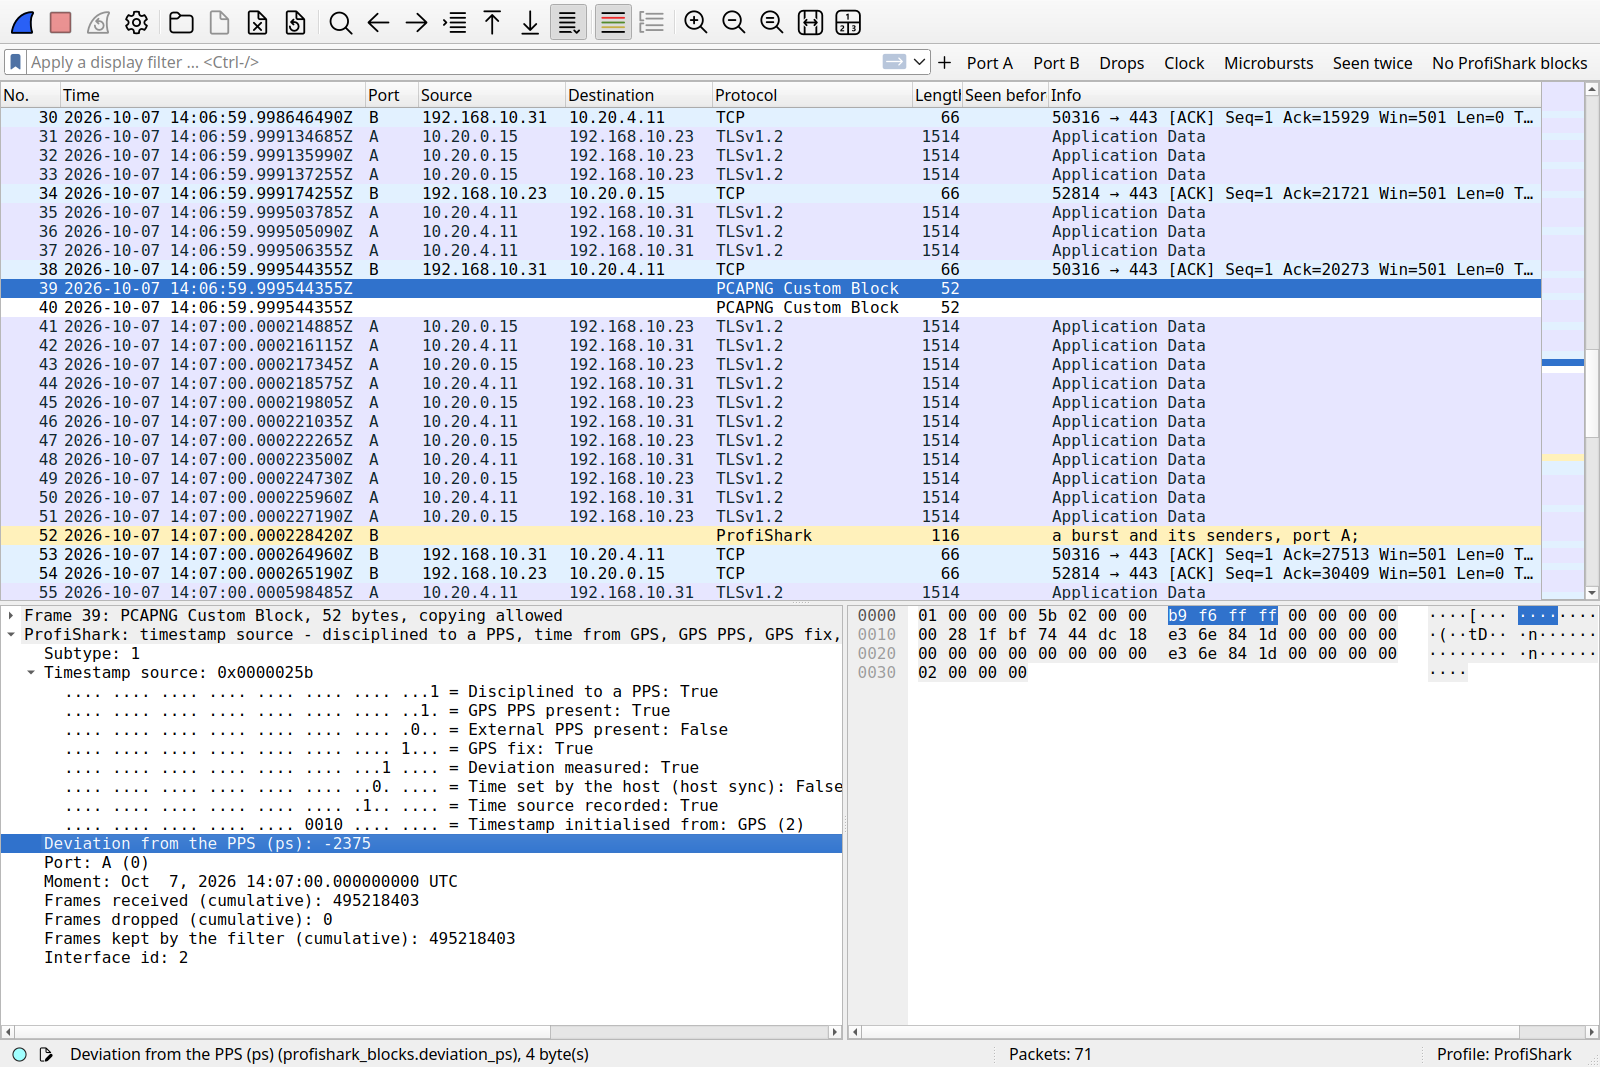
Capture evidence with context
ProfiShark enhances packet captures with diagnostic context collected alongside the traffic, helping engineers understand not only what was captured, but under which conditions.
Capture information can include hardware timestamps, clock synchronization status, device and interface identifiers, capture settings, detailed per-port frame statistics, and — on supported models — diagnostic data such as microburst events.
Fail-safe access for live networks
In-line operation uses active bypass and fast failover, with PoE passthrough. Link Failure Propagation is also supported, so a loss on one side of the link can be reflected to the other side when required by a redundant network design.
One workflow in ProfiShark Manager
ProfiShark Manager combines Gigabit capture, link diagnostics, packet generation, reporting, and Wireshark integration into a single application for Windows, Linux, and macOS.
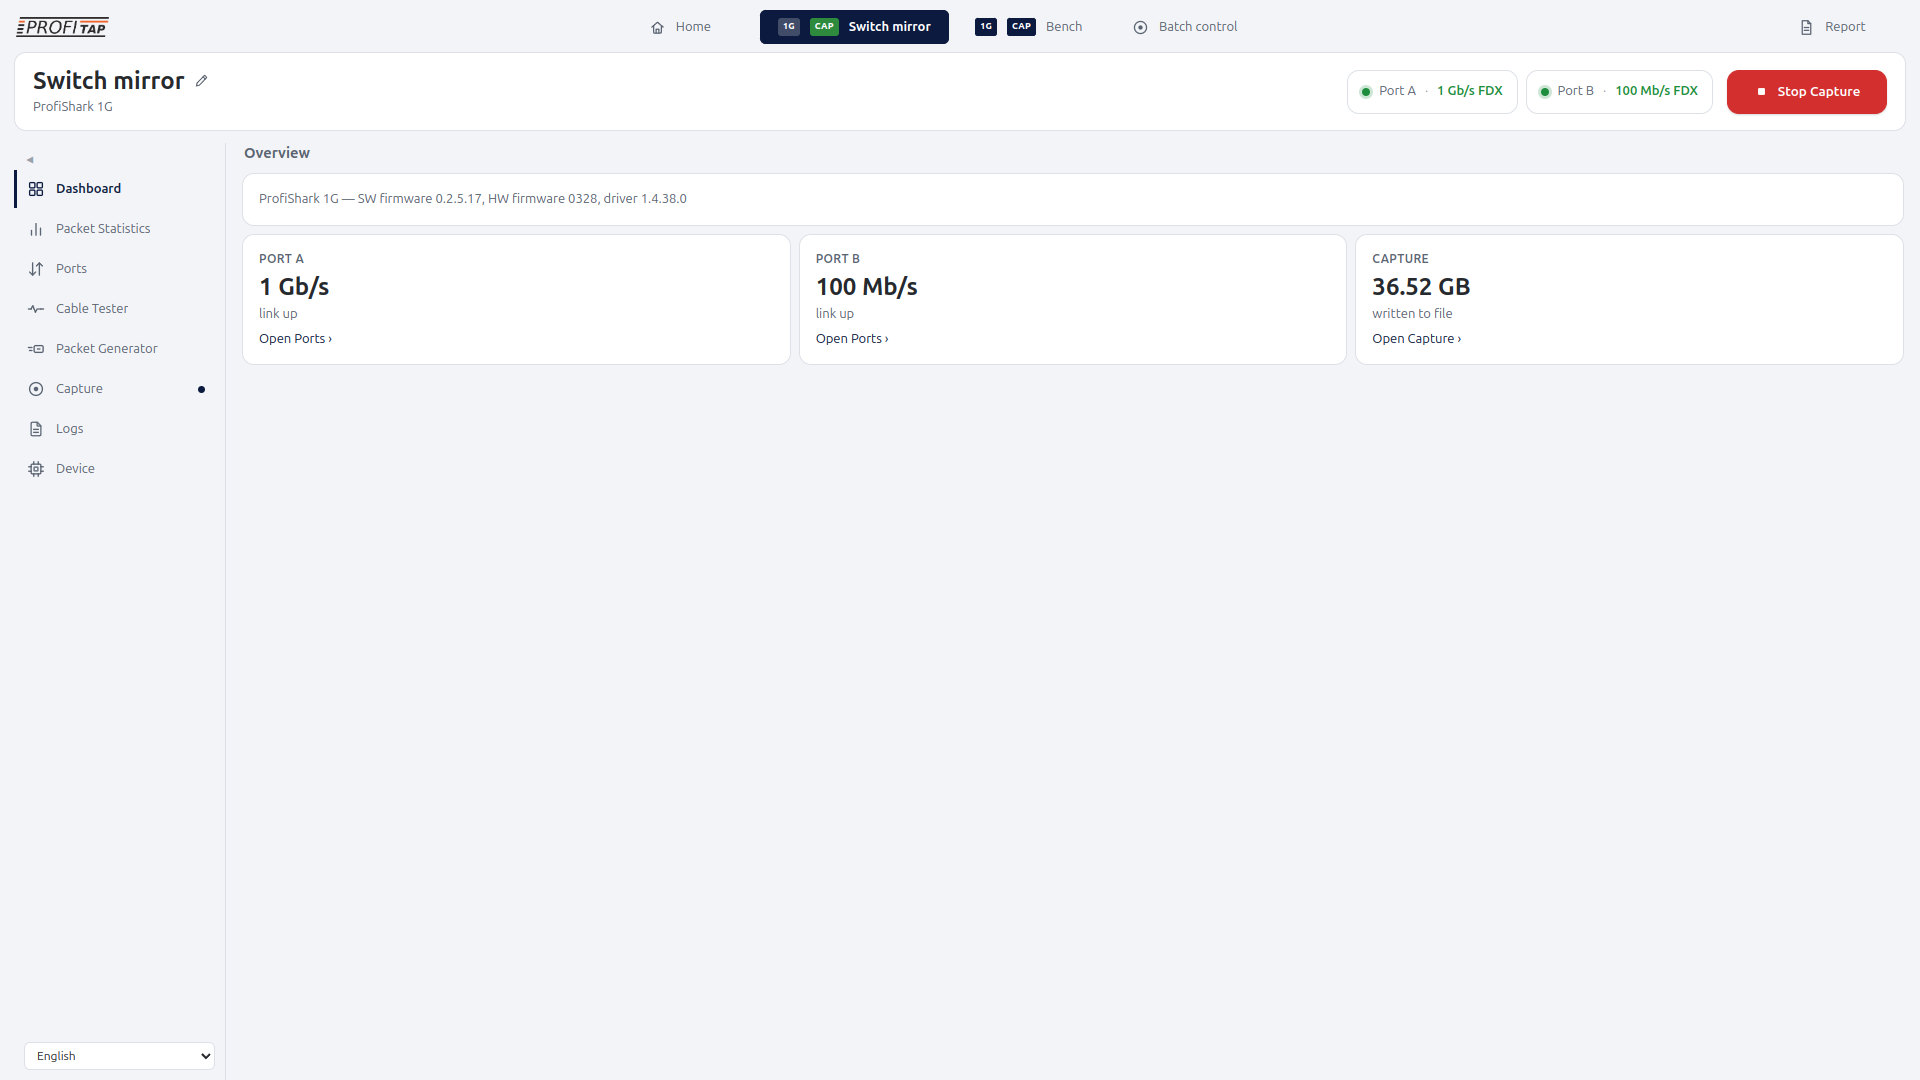
Overview Dashboard
See link state, traffic, capture status, and device health at a glance.
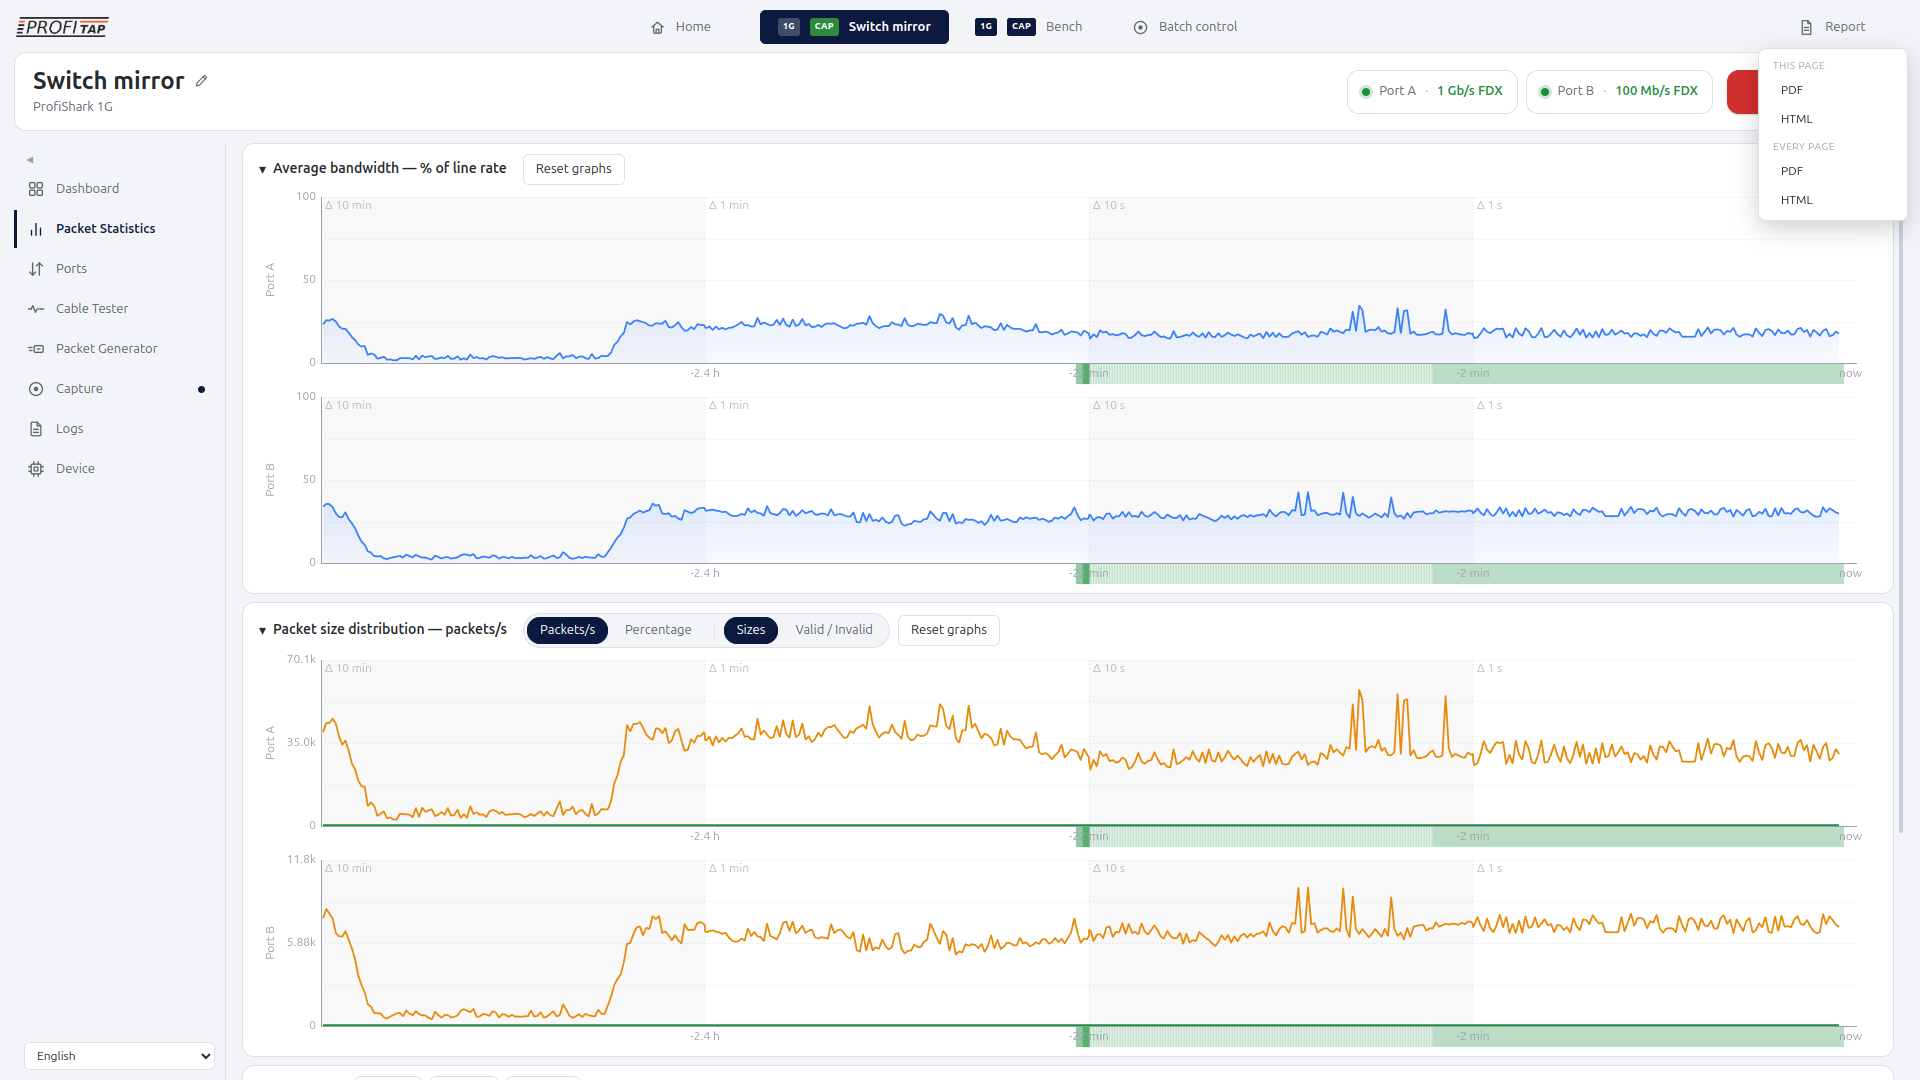
Packet Statistics
Review current and historical packet counts, bandwidth, errors, and per-port behavior.
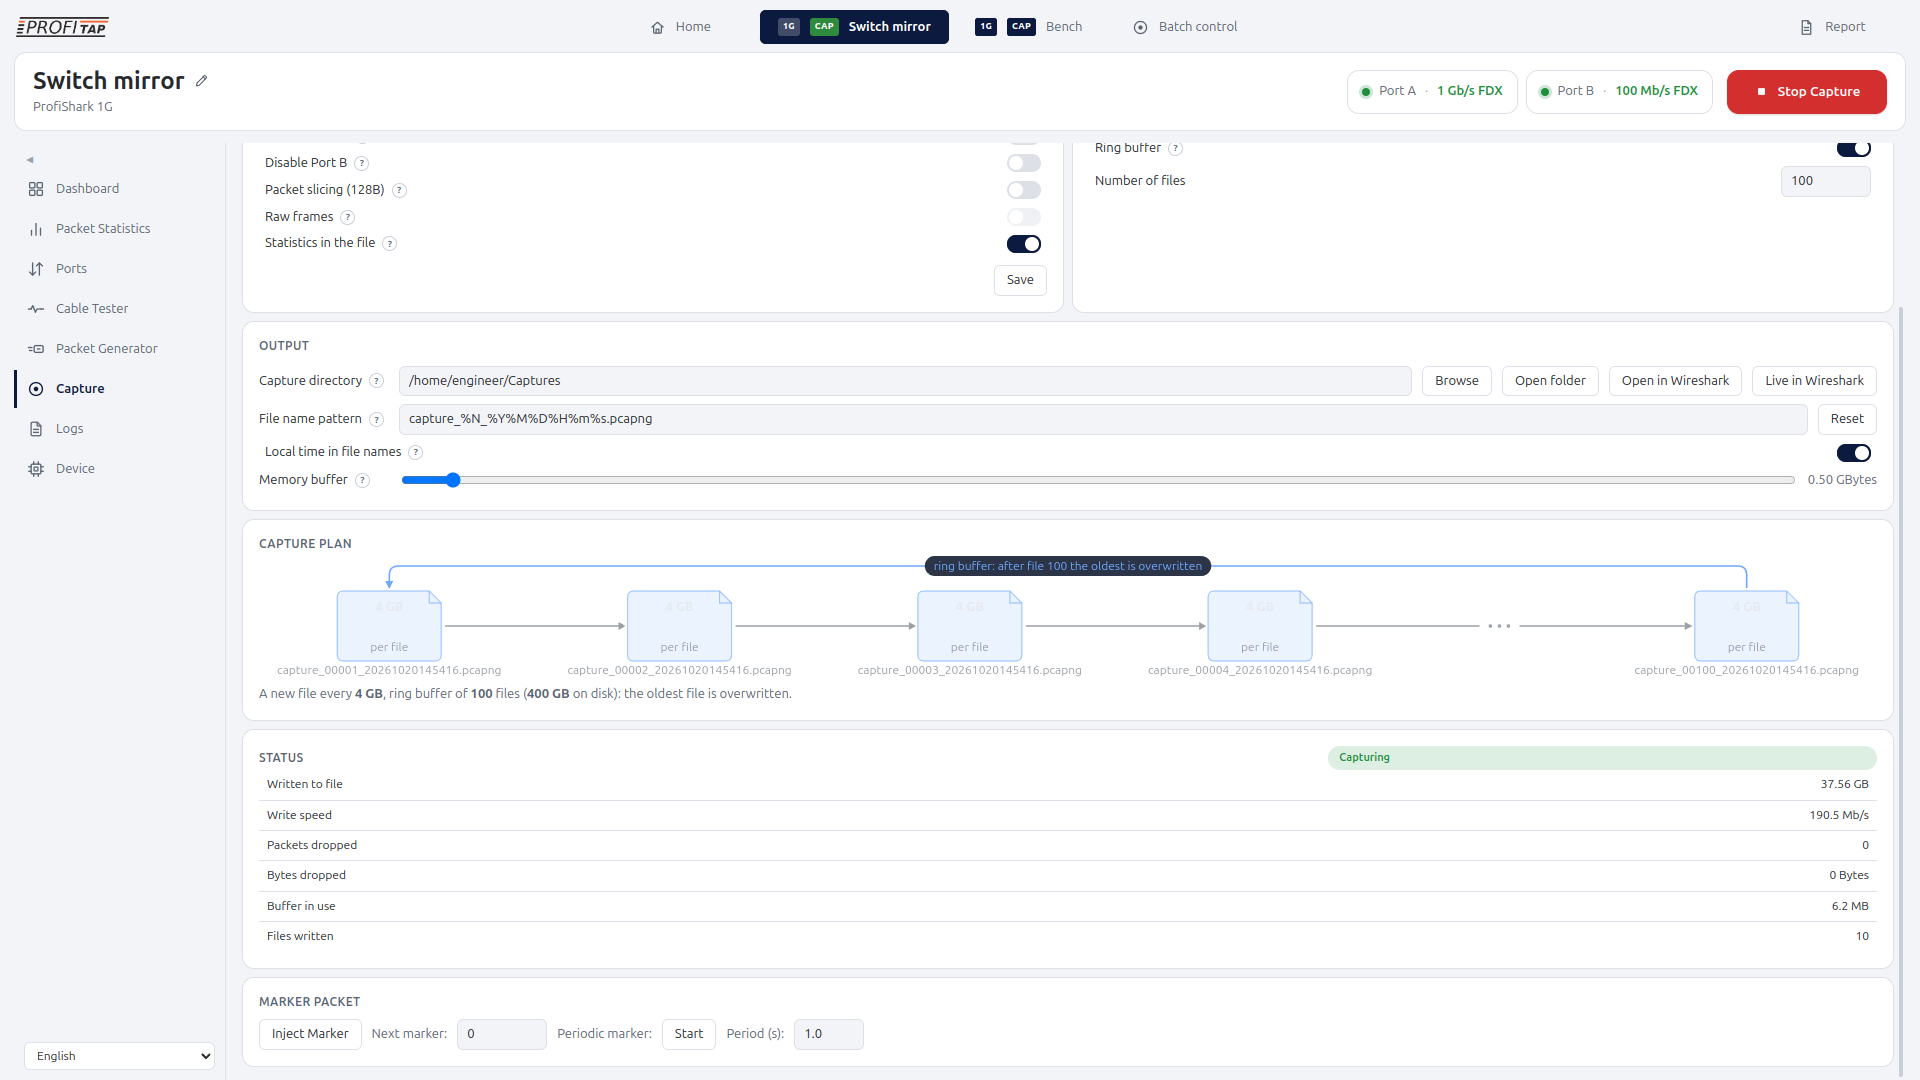
Capture
Build the capture plan, set file size or duration, and control direct capture.
Physical Diagnostics
Inspect cable length/fault distance, wiring, signal quality, negotiation information, and EEE behavior.
Packet Generation
Configure packet generation for controlled link validation.
Reporting
Create a PDF or web report from an individual diagnostic page or the complete available investigation.
Typical applications
Everyday 10/100/1000 Mb/s troubleshooting
Capture traffic, review packet and error statistics, and investigate the physical link when diagnosing common connectivity and performance problems on Gigabit Ethernet.
Industrial Ethernet and TSN-oriented capture workflows
Collect accurately timestamped packet evidence from industrial and timing-sensitive Gigabit networks for analysis in ProfiShark Manager, Wireshark, or compatible tools.
Cable, pair-wiring, and intermittent-link investigation
Check cable length, fault distance, pair wiring, signal quality, and negotiation information while keeping the monitored Ethernet link in service.
Energy Efficient Ethernet troubleshooting
Review and control EEE behavior to determine whether power-saving negotiation contributes to latency, packet loss, or intermittent connectivity issues.
Commissioning and field validation with packet generation
Generate controlled traffic with defined frame length, rate, and packet count to verify link behavior during installation, commissioning, or remediation.
SPAN / mirror-port capture and packet analysis
Use the two network ports as independent inputs for mirrored traffic and capture packet evidence without placing ProfiShark directly in-line.
Long-term capture of intermittent problems
Record traffic directly to storage over extended periods so sporadic faults can be preserved for later packet-level and statistical investigation.
Specifications
| Network technology | 10/100/1000 Mb/s Ethernet |
|---|---|
| Network ports | 2 x RJ45 8-pin |
| Monitoring modes | In-line and SPAN (out-of-band dual input) |
| Network behavior | Non-intrusive, invisible to the network, physical isolation from the management interface |
| Fail-safe | Active bypass and fast failover in in-line mode |
| PoE | PoE passthrough |
| Link Failure Propagation | Supported |
| Capture performance | Full-duplex GbE (2 Gbit/s) capture, 3.2 Mpps, timestamping, and aggregation at wirespeed |
| Capture format | pcapng |
| Capture context | Device, interface, timing, capture settings, and per-port statistics are embedded alongside packet data |
| Capture modes | Live capture, direct capture to disk, long-term capture/ring buffer |
| Timestamping | 8 ns hardware timestamp at ingress |
| Packet slicing | Yes, available as a capture option (128 bytes) |
| Port monitoring | Per-port packet-drop and CRC counters, real-time statistics, low-level error, and bandwidth monitoring |
| Cable diagnostics | Live cable length/fault distance by pair, pair wiring, negotiated role, link-partner information, signal quality value |
| Energy Efficient Ethernet | Reporting and control |
| Packet generation | Packet generation with configurable frame length, rate, and packet count; transmitted/received and CRC-error results |
| Host connection | USB 3.0 |
| Optional power input | 5 VDC can be used to prevent failover when disconnecting USB |
| Maximum network latency | 1 Gbps: 380 ± 8 ns, 100 Mbps: 720 ± 24 ns, 10 Mbps: 7600 ± 25 ns |
| Dimensions (WxDxH) | 69 x 124 x 24 mm / 2.72 x 4.88 x 0.94 in |
| Weight | 176 g / 0.39 lb |
| Software | ProfiShark Manager, Wireshark integration, CLI, reporting |
| Operating systems | Windows, Linux, macOS |
| System requirements | Dual Core processor, 4 GB memory, USB 3.0 port |
| Included accessories | USB 3.0 cable (1.8 m), Ethernet Cat6a cable (2 m), transport pouch |
| Compliance | RoHS, CE, UKCA, EAC, EN 45545-2 |
| Order reference | C1AP-1G |
Thank you!
Your submission has been sent. If you want more information, solutions, and use cases, check out the links below:Did You Know?

FAQ
What is ProfiShark 1G?
A portable 10/100/1000 Mb/s packet capture and diagnostics tool with in-line and SPAN deployment, hardware timestamping, copper-link diagnostics, and packet generation.
Can ProfiShark 1G be used in-line and with SPAN traffic?
Yes. It can be deployed in-line or use its two capture ports as independent inputs for mirrored traffic.
Does ProfiShark 1G test Ethernet cabling?
Yes. It can report pair length or fault distance, wiring, negotiated role, link-partner information, and signal quality while the link remains active.
Can it help troubleshoot Energy Efficient Ethernet?
Yes. EEE behavior can be reported, and the ProfiShark advertisement can be controlled during testing.
Can ProfiShark 1G generate traffic?
Yes. Packet generation supports configurable frame length, rate, and packet count for controlled link validation.
Is the in-line operation fail-safe?
Yes. ProfiShark 1G uses active bypass and fast failover and supports PoE passthrough.
Can ProfiShark Manager create reports for 1G?
Yes. Reporting is available through ProfiShark Manager and can include the diagnostic pages and measurements available for ProfiShark 1G.
Can I analyze captures in Wireshark?
Yes. ProfiShark 1G integrates with Wireshark and other compatible packet analyzers.
Related products
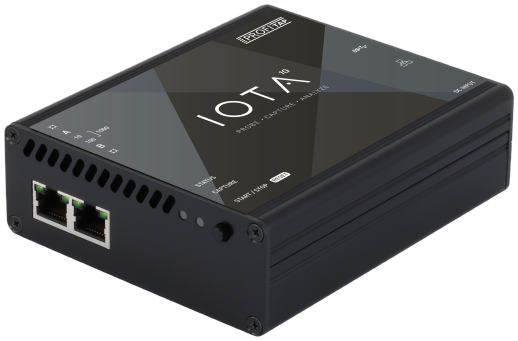
IOTA 1G
A multifunctional passive network probe with integrated traffic capture and analysis capabilities.
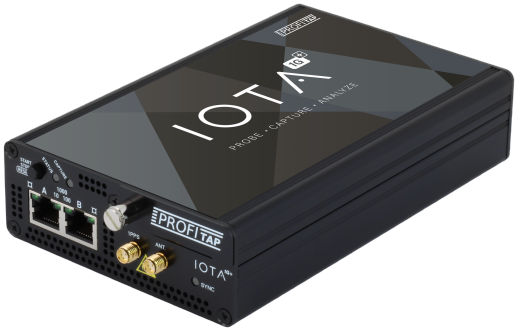
IOTA 1G+
A multifunctional passive network probe with integrated traffic capture and analysis capabilities.
ProfiShark 1G+
The Gigabit ProfiShark workflow with GPS/Galileo/GLONASS and PPS advanced timestamp synchronization.