Performance analysis & diagnostics solutions
Discover moreProfitap network observability delivers
Performance analysis and diagnostics are vital in maintaining optimal network operation, ensuring seamless business operations and user satisfaction.
Our deep network observability solutions are designed to provide unparalleled insight into your network’s performance, enabling proactive performance analysis and diagnostics, and improve overall efficiency, network performance, and Mean Time To Resolution.
Comprehensive Traffic Capture
High-Fidelity Data: Capture network traffic with precision, ensuring no packet is lost, allowing for accurate and thorough analysis.
Scalability: Our solutions scale with your network, from capturing on remote and edge locations, to core networks without compromising performance.
Proactive Diagnostics
Network Baselining: Spot anomalies faster by measuring standard performance metrics during typical operation conditions to establish a reference point.
Root Cause Analysis: Quickly pinpoint the root cause of network issues, reducing downtime and enhancing the efficiency of your IT team.
Performance Optimization
Bandwidth Utilization: Optimize bandwidth allocation and usage to ensure critical applications receive the necessary resources.
Latency Reduction: Identify and mitigate sources of latency, ensuring swift data transmission and improved application performance.
Advanced Analytics
Real-Time Monitoring: Get instant visibility into network performance metrics and anomalies as they occur.
Historical Data Analysis: Retain and analyze historical traffic data to identify trends and recurring issues, aiding in long-term performance optimization.
Network performance & protocol analysis with IOTA
Accelerate incident response & network performance
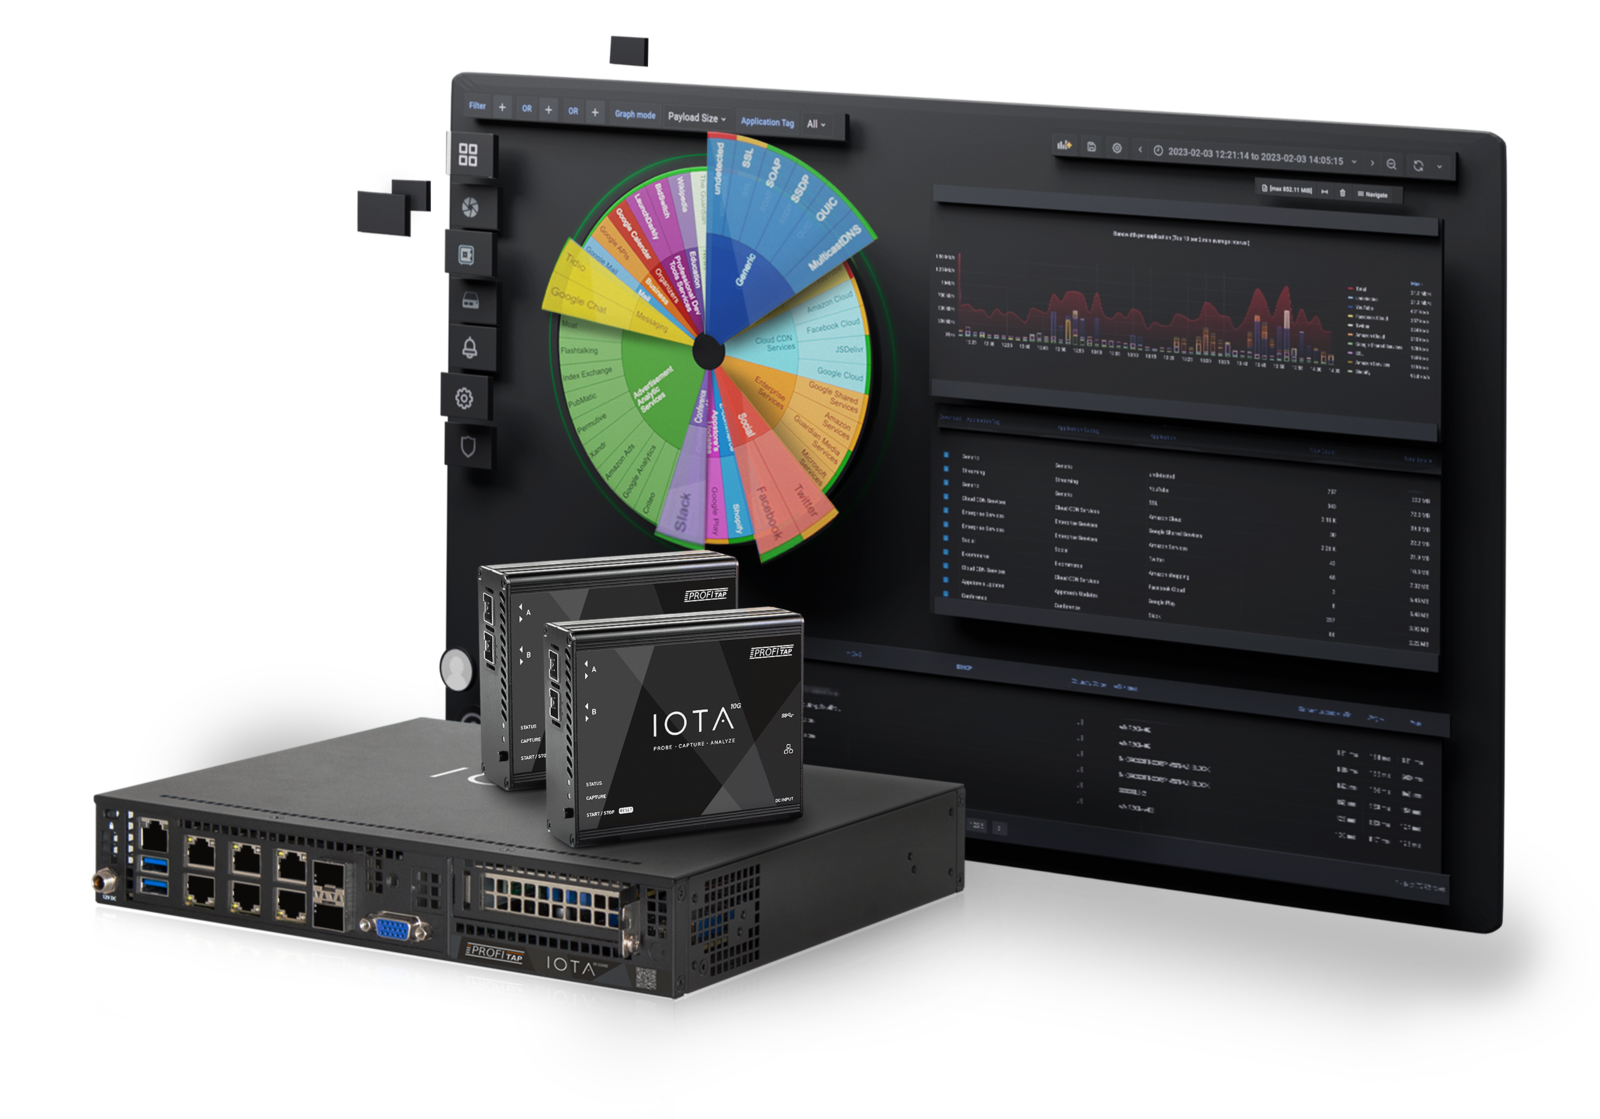
Profitap IOTA is a powerful network analysis tool for traffic capture and performance analysis. It offers comprehensive insights into network traffic, allowing for real-time and historical monitoring and troubleshooting of network data. With its advanced features and intuitive interface, Profitap IOTA simplifies identifying and resolving protocol-related issues, with full visibility into 3000+ applications and protocols (DNS, HTTP, SSH, Office 365, Skype, Whatsapp, Netflix, etc.).
Enhance network visibility
Profitap IOTA provides both a global view of the network, and granular visibility into network traffic, applications and protocols, enabling efficient monitoring and analysis.
Improve user experience
Ensure business-critical operations run smoothly for customers and employees, with a quick overview into experience indicators, such as jitter, throughput, and packet loss.
Improve network performance
By identifying bottlenecks and latency issues, Profitap IOTA helps optimize network performance, improving overall efficiency.
Classify encrypted traffic
IOTA classifies encrypted traffic with Machine learning-based protocol and application classification technology.
Improve application performance
Get a clear overview of which components may slow your applications down and which services consume too much bandwidth.
Faster troubleshooting
With real-time monitoring and analysis capabilities, Profitap IOTA allows for prompt identification and resolution of protocol performance issues.
Save costs
The ability to quickly diagnose and resolve protocol-related problems with Profitap IOTA minimizes downtime and reduces operational costs.
Future-proof
Given the ever-changing landscape of network protocols, Profitap IOTA can be relied upon to provide detailed network insights now and in the future.
Traffic capture & analysis right at your fingertips
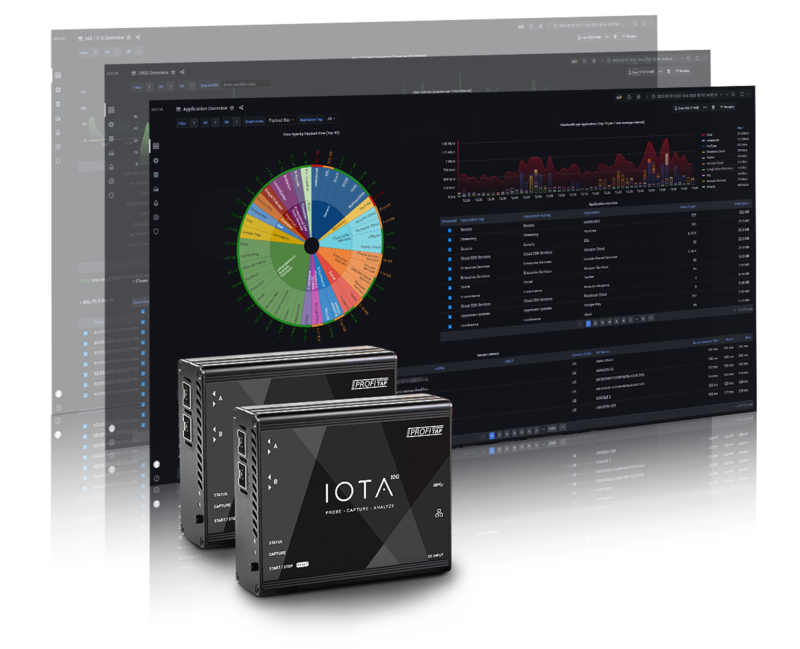
IOTA EDGE
- Deployed on edge and remote sites.
- Integrated analysis dashboards accessible locally or remotely.
- In-line or out-of-band.
- 1 TB or 2 TB capture storage.
- Capture performance 3.2 Gbps.
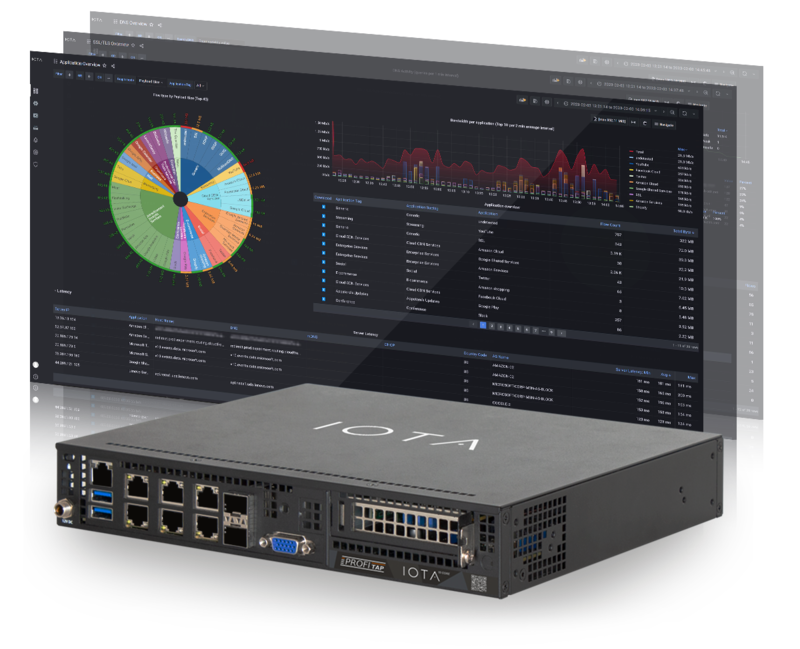
IOTA CORE
- Deployed on central capture point.
- Integrated analysis dashboards accessible locally or remotely.
- Out-of-band.
- 4, 8, or 16 TB capture storage.
- Capture performance 20 Gbps.
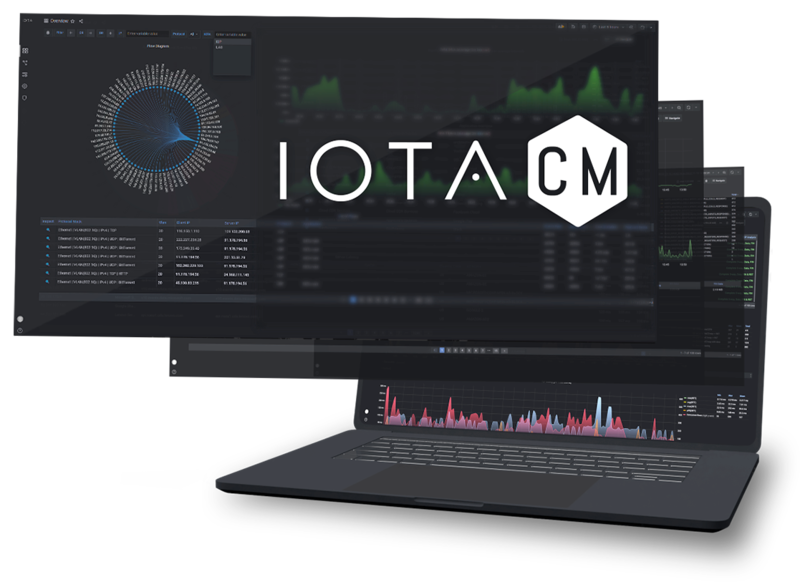
Centralized management application
- Central interface for bird’s-eye view insight into IOTA analytics.
- Fleet management and maintenance.
- Multi-segment analysis: Latency measurement between different capture points for edge IOTAs.
Resources
Application latency analysis
More and more applications are provided by cloud providers as SaaS from globally distributed data centers. Normally, this offers easy application deployment. However, it also brings new error…
Troubleshooting DNS
There is a saying: “It’s not DNS. There is no way it’s DNS. It was DNS”. This makes it clear that DNS is an integral part of IT infra-structure services and can exhibit a wide variety of error…
Network monitoring in virtual and physical multi-tenant networks
A multinational technology company specialized in cloud communications and workstream collaboration solutions with multiple global sites tasked Profitap to design a constant and…
