
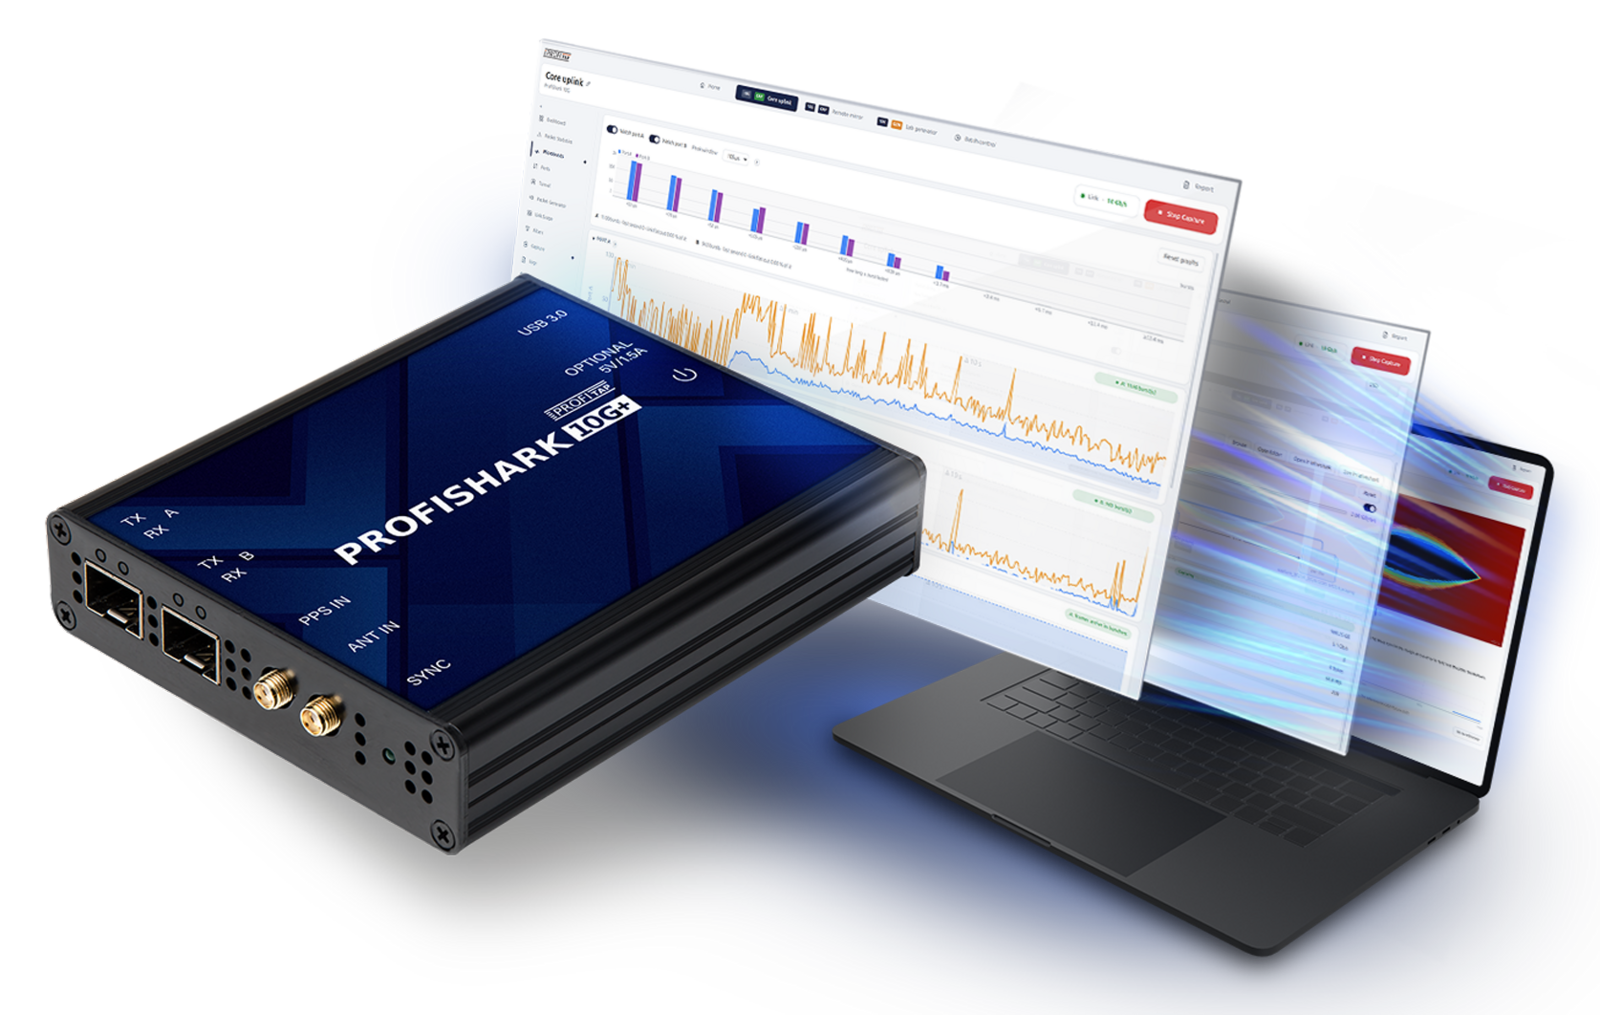
Complete packet capture and diagnostics with advanced timestamping
ProfiShark 10G+ combines the 1/10 Gb/s capture, hardware filtering, SFP diagnostics, and traffic statistics of ProfiShark 10G with advanced time synchronization. GPS, Galileo, GLONASS, SNTP, and PPS allow high-speed packet events to be correlated across systems and measurement points, while Advanced Packet Diagnostics can add active testing and deeper diagnostics.
Key benefits
- 1/10 Gb/s SFP/SFP+ capture with 5 ns hardware timestamps
- GPS/Galileo/GLONASS UTC timing and PPS input/output
- Hardware filtering, SFP diagnostics, and traffic statistics
- Optional Advanced Packet Diagnostics for line-rate testing, microbursts, Link Scope, and tunnel termination
High-speed capture with external timing
Use ProfiShark 10G+ with supported 1G or 10G copper and fiber SFP/SFP+ modules in out-of-band workflows or SFP-dependent in-line deployments. USB 3.0 connects the device to ProfiShark Manager, while GNSS and PPS provide external time references for synchronized packet capture.
ProfiShark 10G+ helps you
Capture accurately
Record 1/10G traffic with 5 ns hardware timestamps and align packet events to GPS, Galileo, GLONASS, SNTP, or an external PPS reference.
Diagnose the link
Inspect SFP identity and diagnostics, hardware counters, traffic diversity, and the behavior of each port without leaving the ProfiShark workflow.
Validate with line-rate traffic
With Advanced Packet Diagnostics, generate and replay traffic at line rate, reproduce captured timing and frame characteristics, and verify downstream behavior.
Report the findings
Create a PDF or web report from ProfiShark Manager so packet timing, measurements, charts, and any licensed diagnostics can be shared in one investigation record.
Correlate high-speed packet events across systems
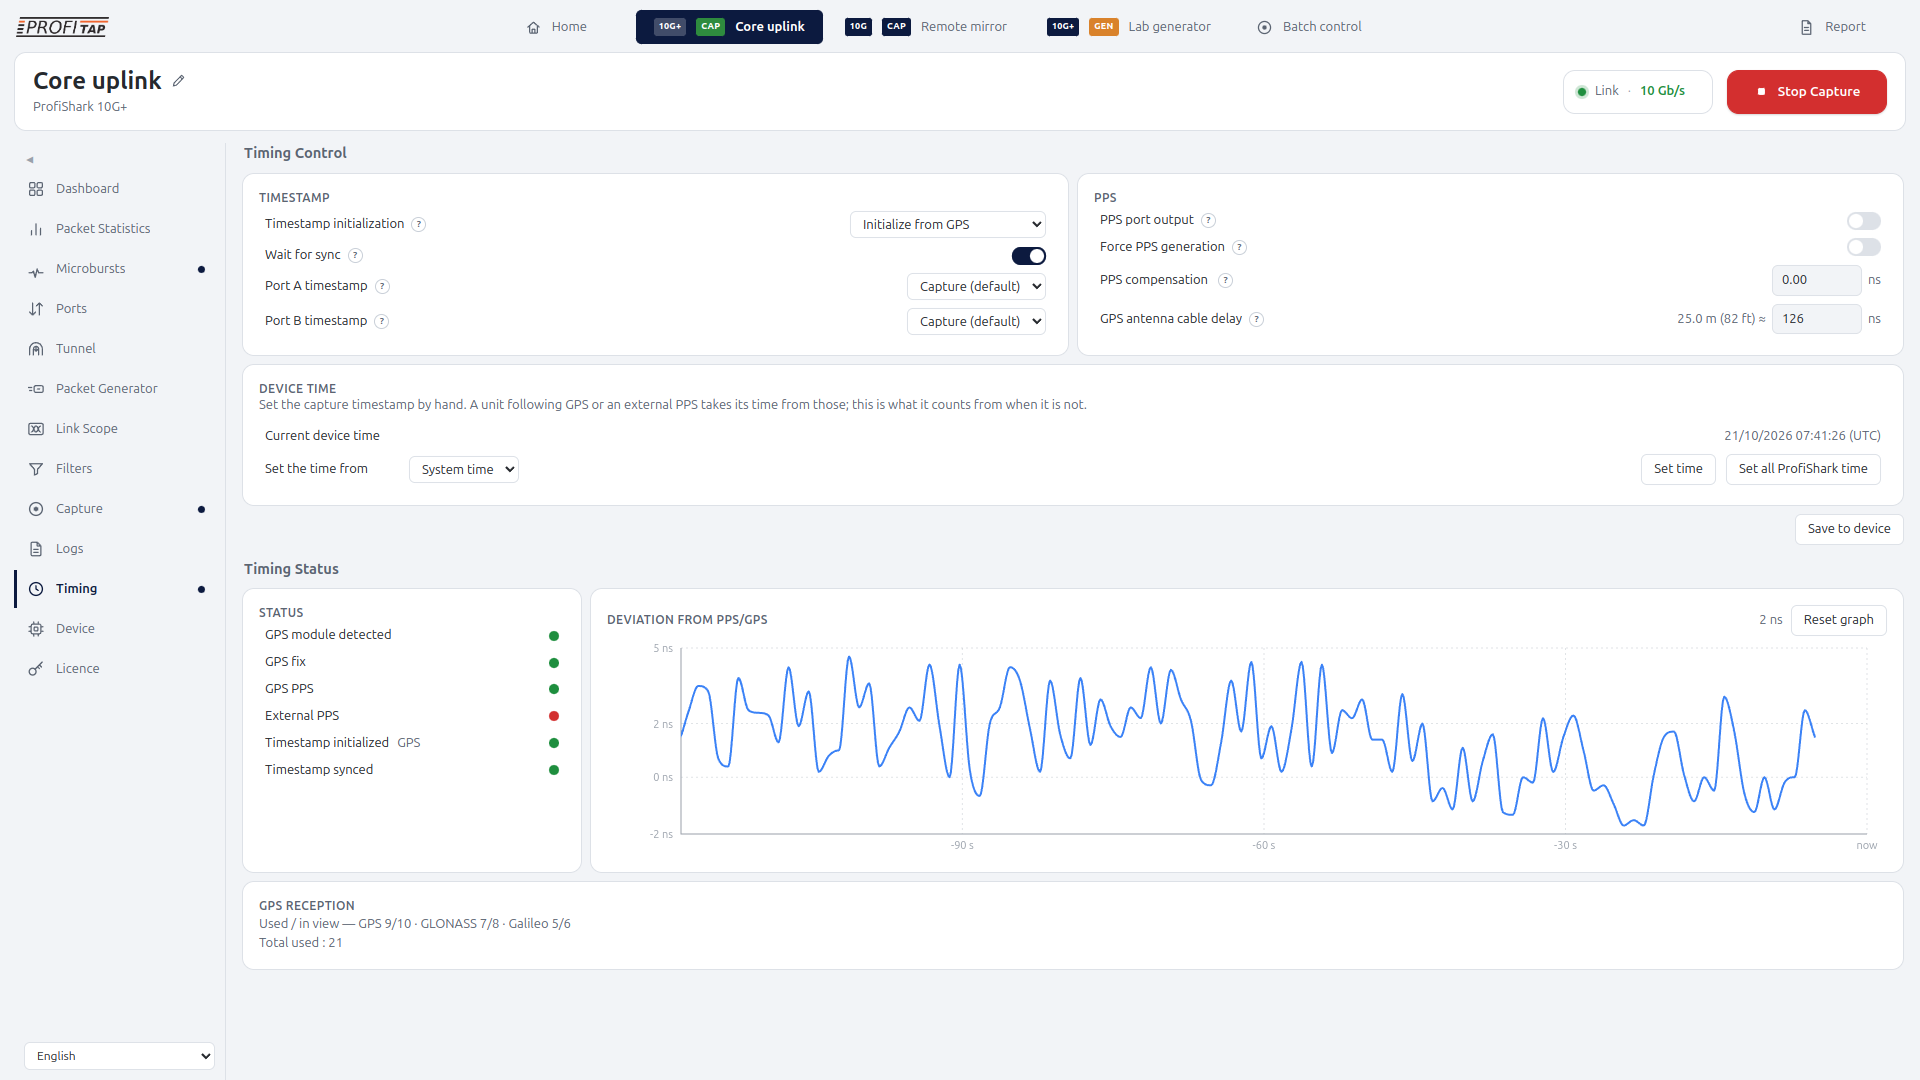
Every captured frame receives a 5 ns hardware timestamp at ingress. Advanced timing lets ProfiShark 10G+ align timestamps to GNSS UTC or an external PPS reference and also supports SNTP or the internal real-time clock as part of the timing workflow.
GPS, Galileo, and GLONASS are supported. PPS can be used as input or output, and PPS cable correction and antenna delay compensation help account for the timing path.
Capture and filter 1/10G traffic in hardware
Hardware filtering, deep packet inspection, and packet slicing reduce the traffic sent to the host while the device continues processing the link at line rate. Filters can target packet types, addresses, ports, VLANs, protocol classes, broadcast/multicast/unicast traffic, and deep-inspection patterns.
Inspect SFPs and watch the traffic mix
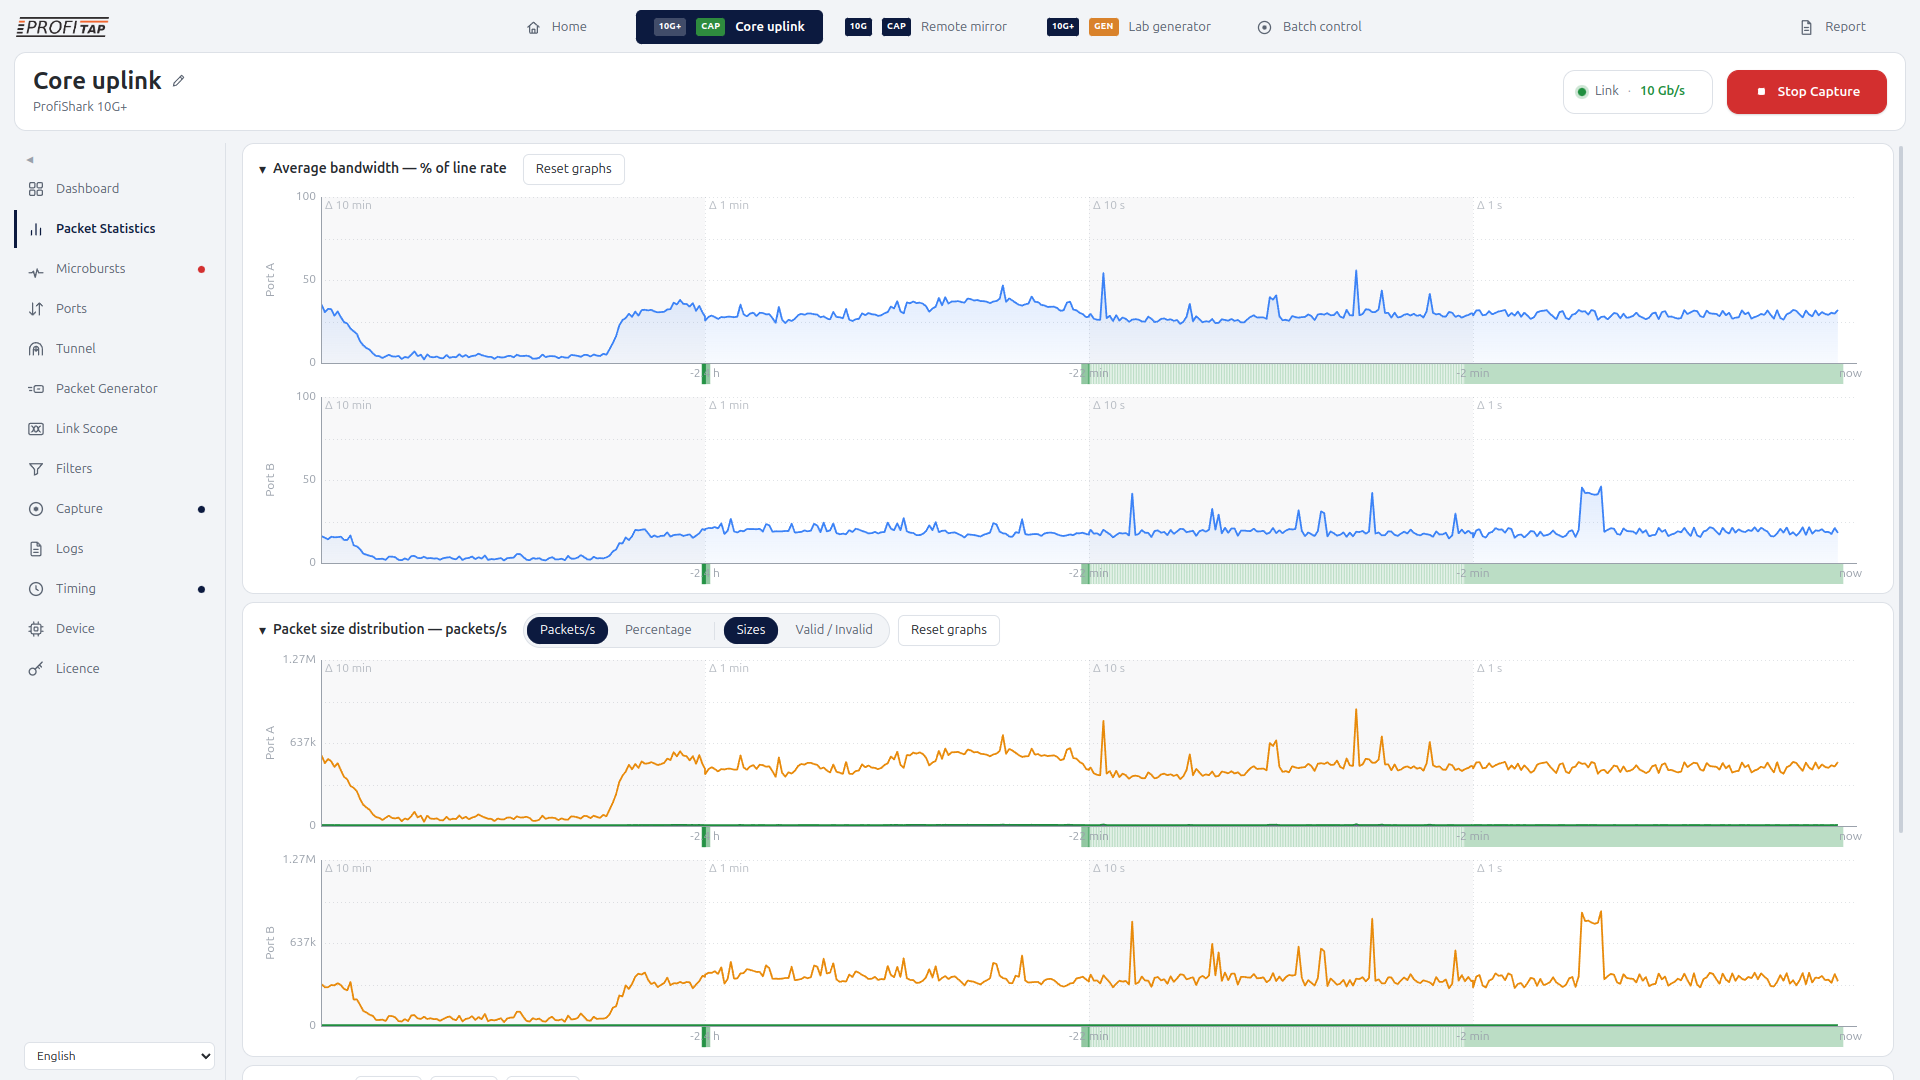
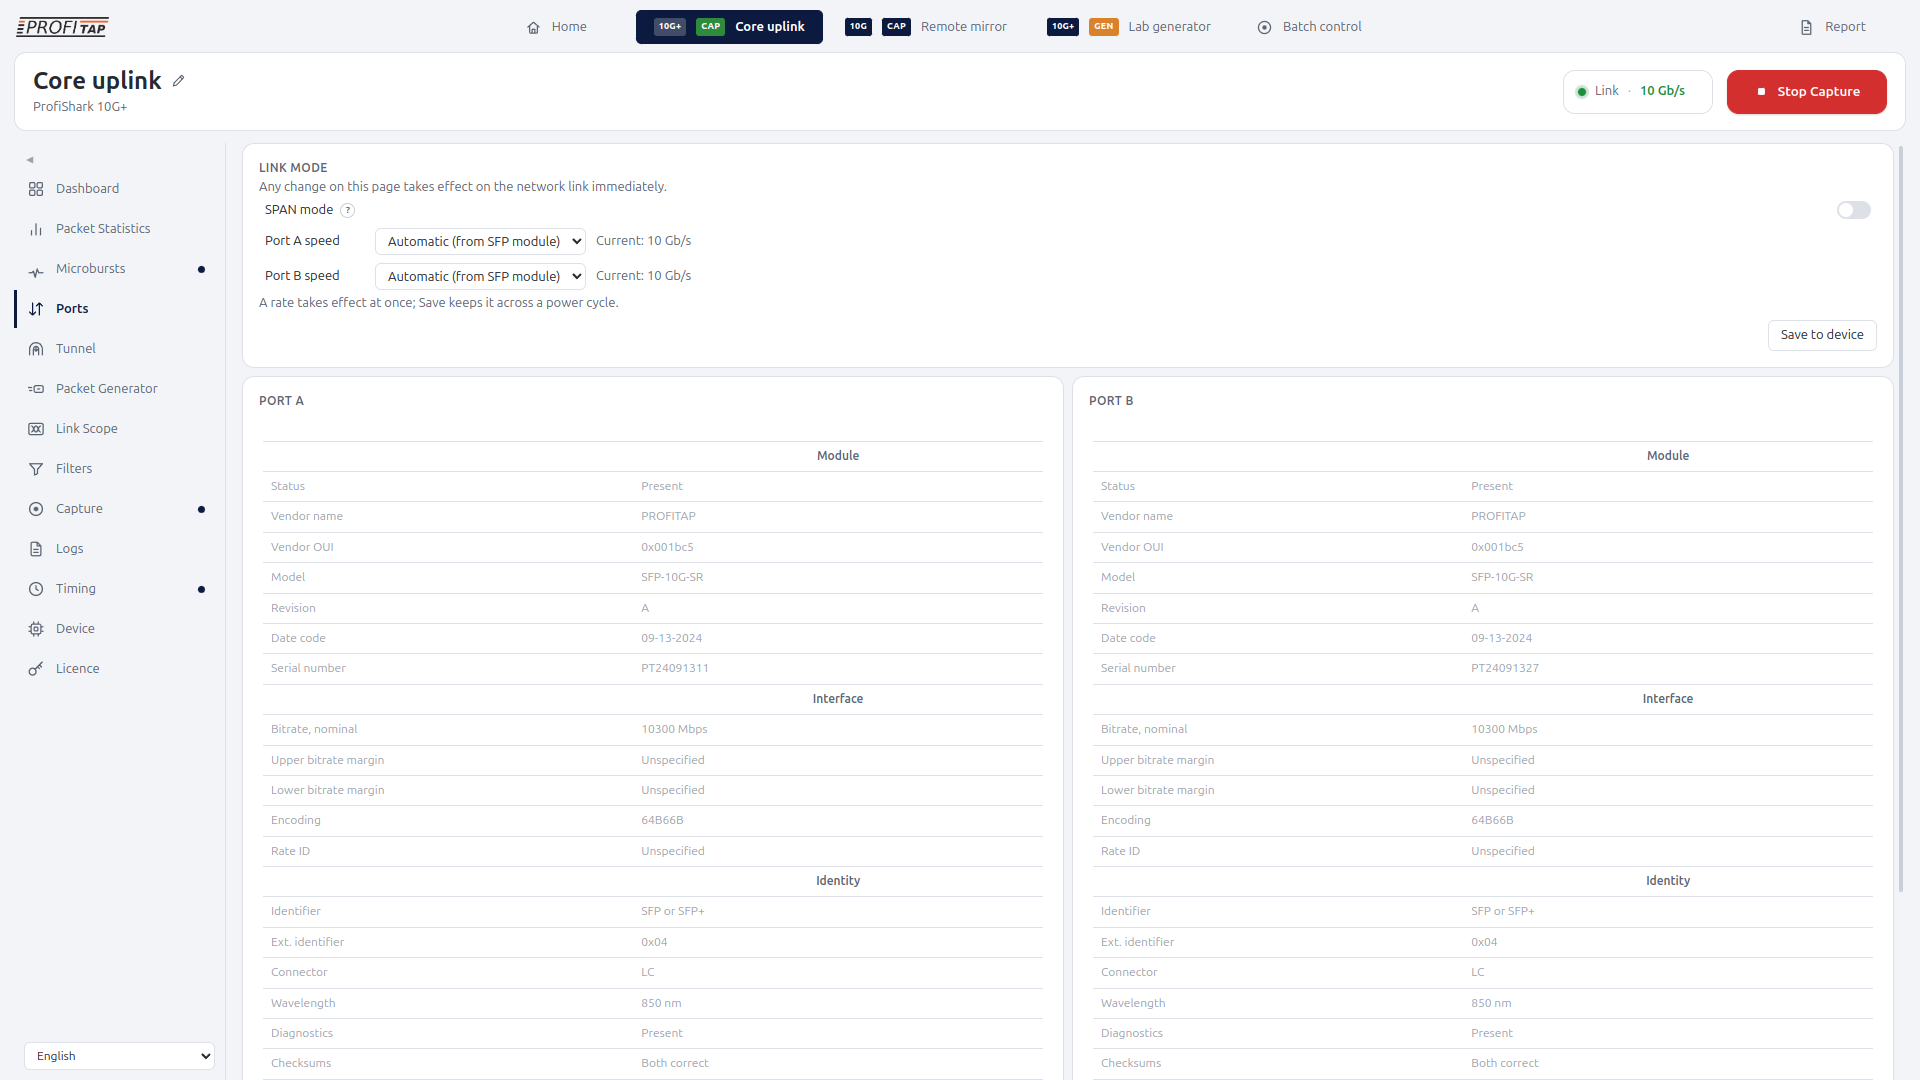
Each port can run independently at 1 or 10 Gb/s. ProfiShark Manager reads transceiver identity and available diagnostics. Traffic statistics track distinct IP addresses, MAC addresses, conversations, and VLANs over time.
Capture evidence with context
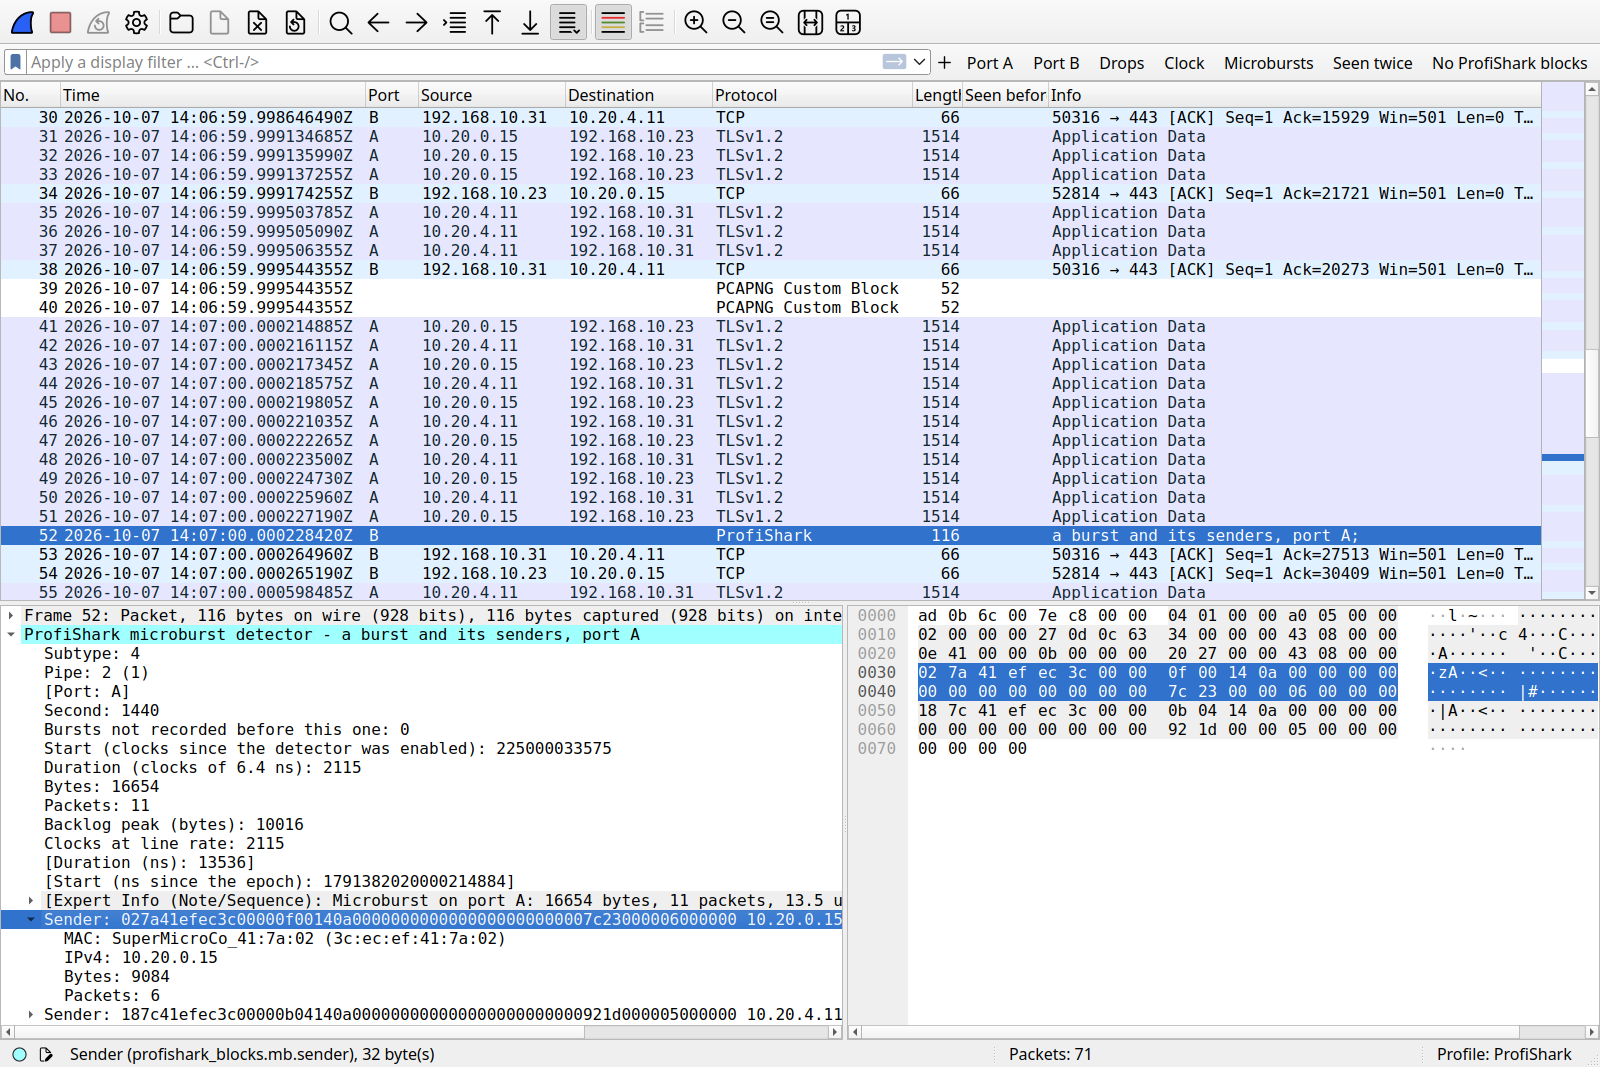
ProfiShark enhances packet captures with diagnostic context collected alongside the traffic, helping engineers understand not only what was captured, but under which conditions.
Capture information can include hardware timestamps, clock synchronization status, device and interface identifiers, capture settings, detailed per-port frame statistics, and — on supported models — diagnostic data such as microburst events.
Advanced Packet Diagnostics
The optional Advanced Packet Diagnostics license adds four capabilities to ProfiShark 10G+:
- Line-rate traffic generation: Replay captured traffic, preserve recorded timing, generate controlled load profiles, and modify addresses or ports between repetitions.
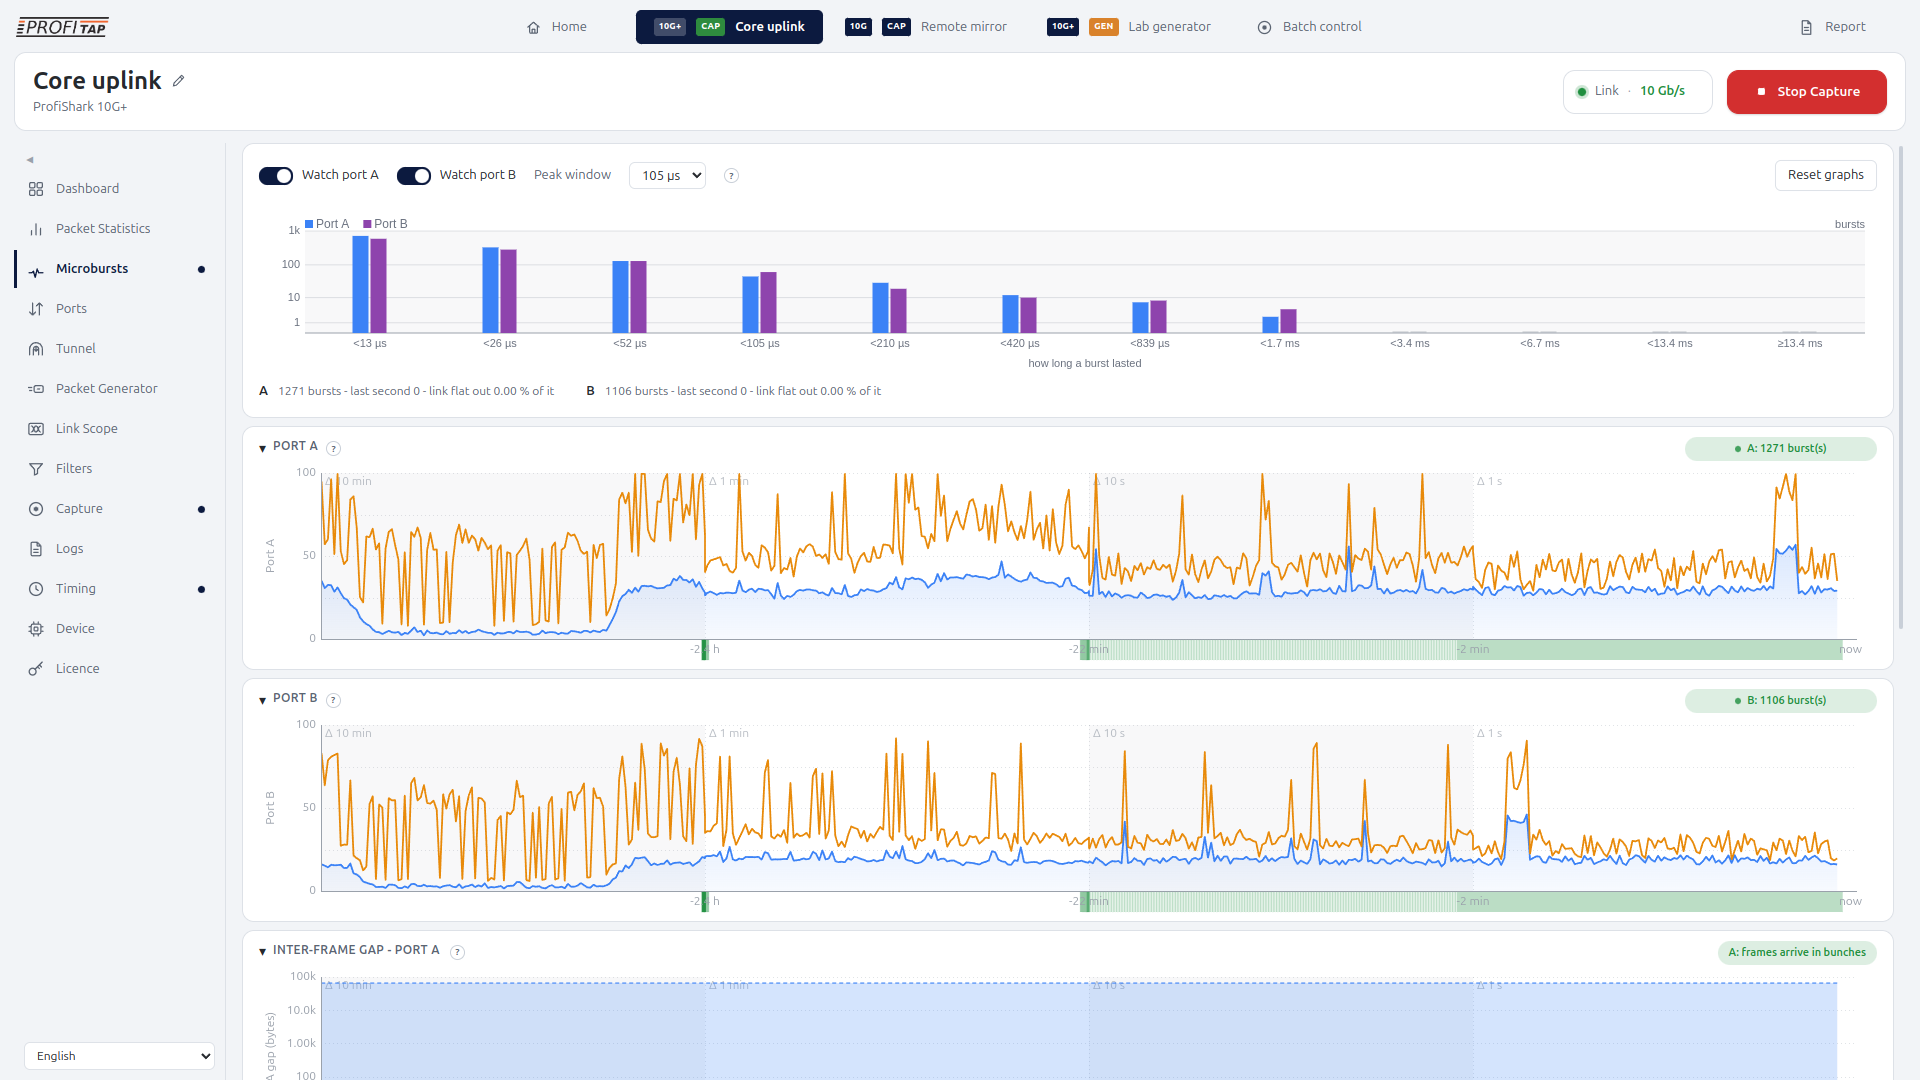
- Microburst Detector: Detect short congestion events, quantify backlog requirements, and identify the senders contributing to a burst.
- Link Scope: Run quick, deep, or continuous signal-quality scans, including eye-diagram, jitter, BER, and optical-power analysis.
- Tunnel Termination: Terminate supported mirrored-traffic tunnels in hardware, so inner traffic can be filtered, captured, and analyzed at line rate.
One workflow in ProfiShark Manager
ProfiShark Manager combines 10G+ capture, synchronized timing, SFP and traffic diagnostics, reporting, and, when licensed, Advanced Packet Diagnostics into a single application.
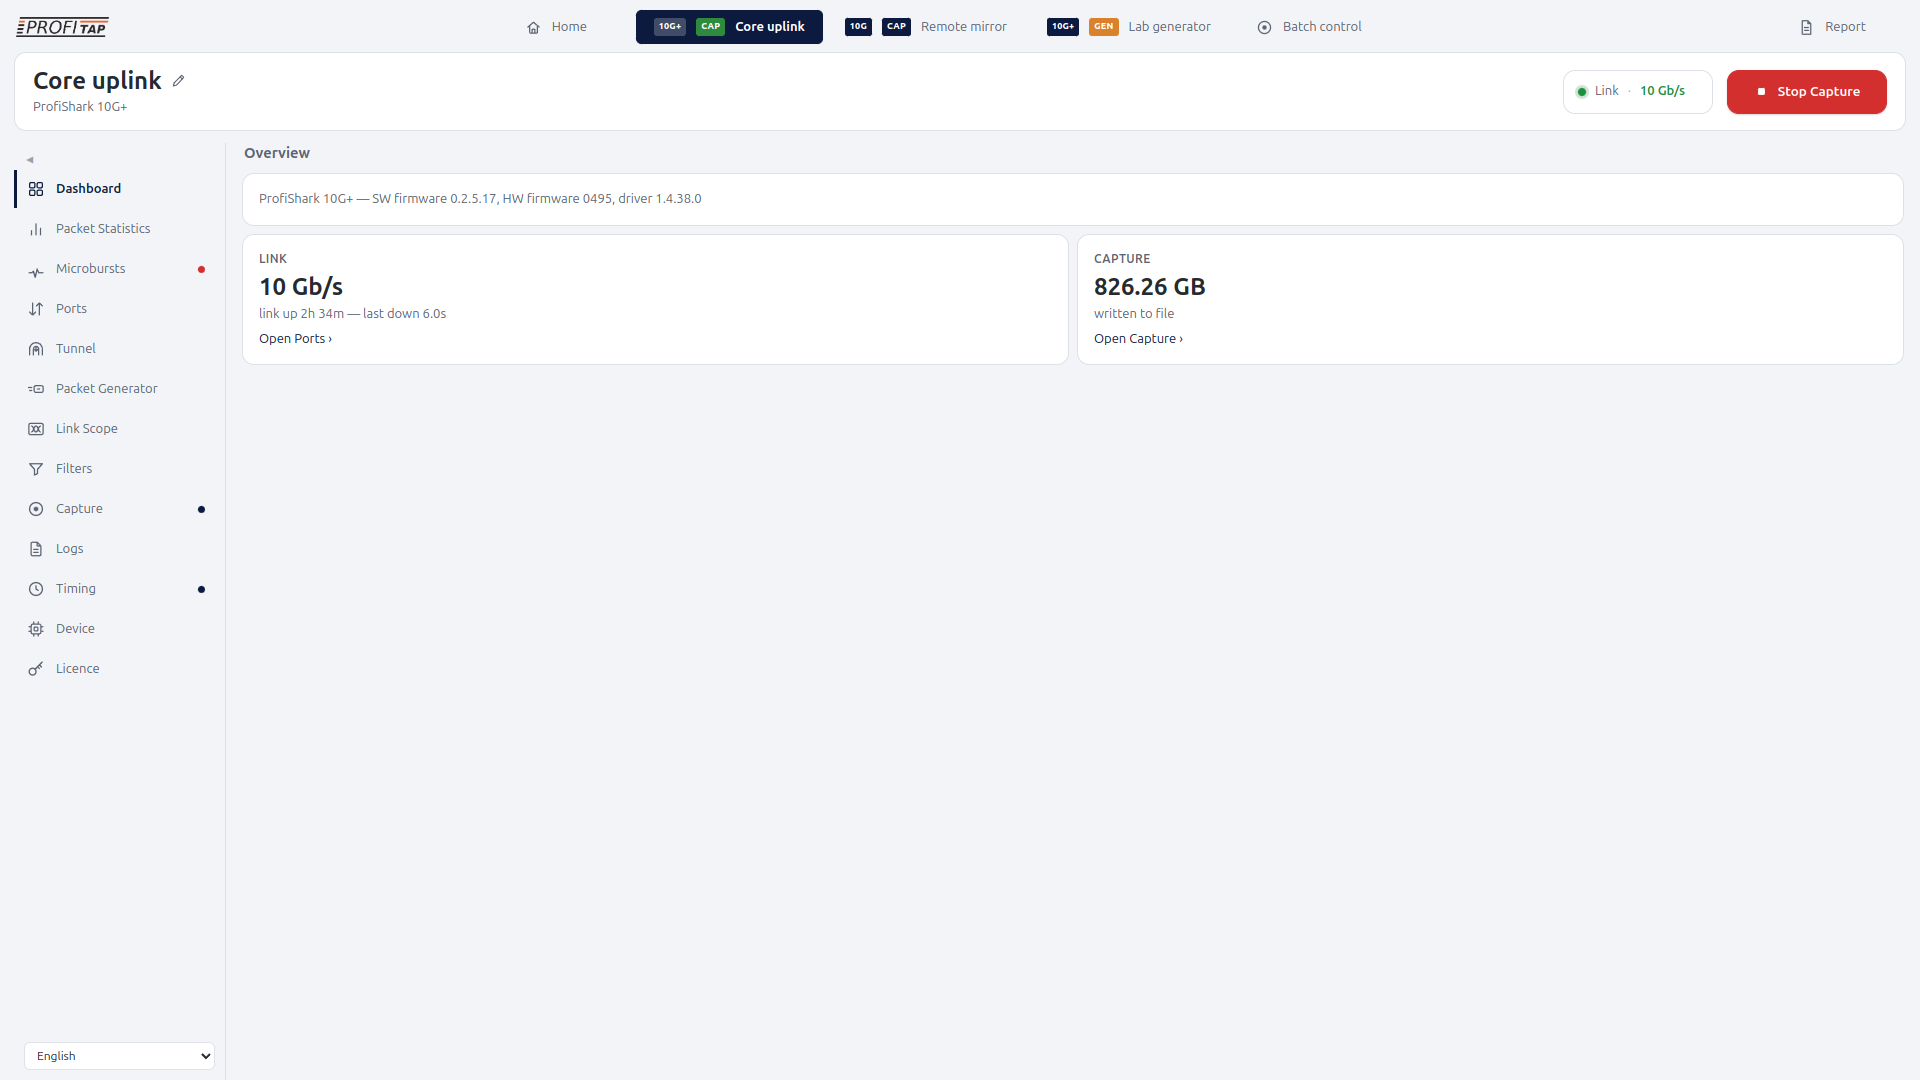
Overview Dashboard
See link state, traffic, capture status, and device health at a glance.
Packet Statistics
Review exact per-port traffic, packet-size, error, and bandwidth measurements over time.
Timing
Configure and monitor GNSS, PPS, SNTP, RTC, and timing compensation settings.
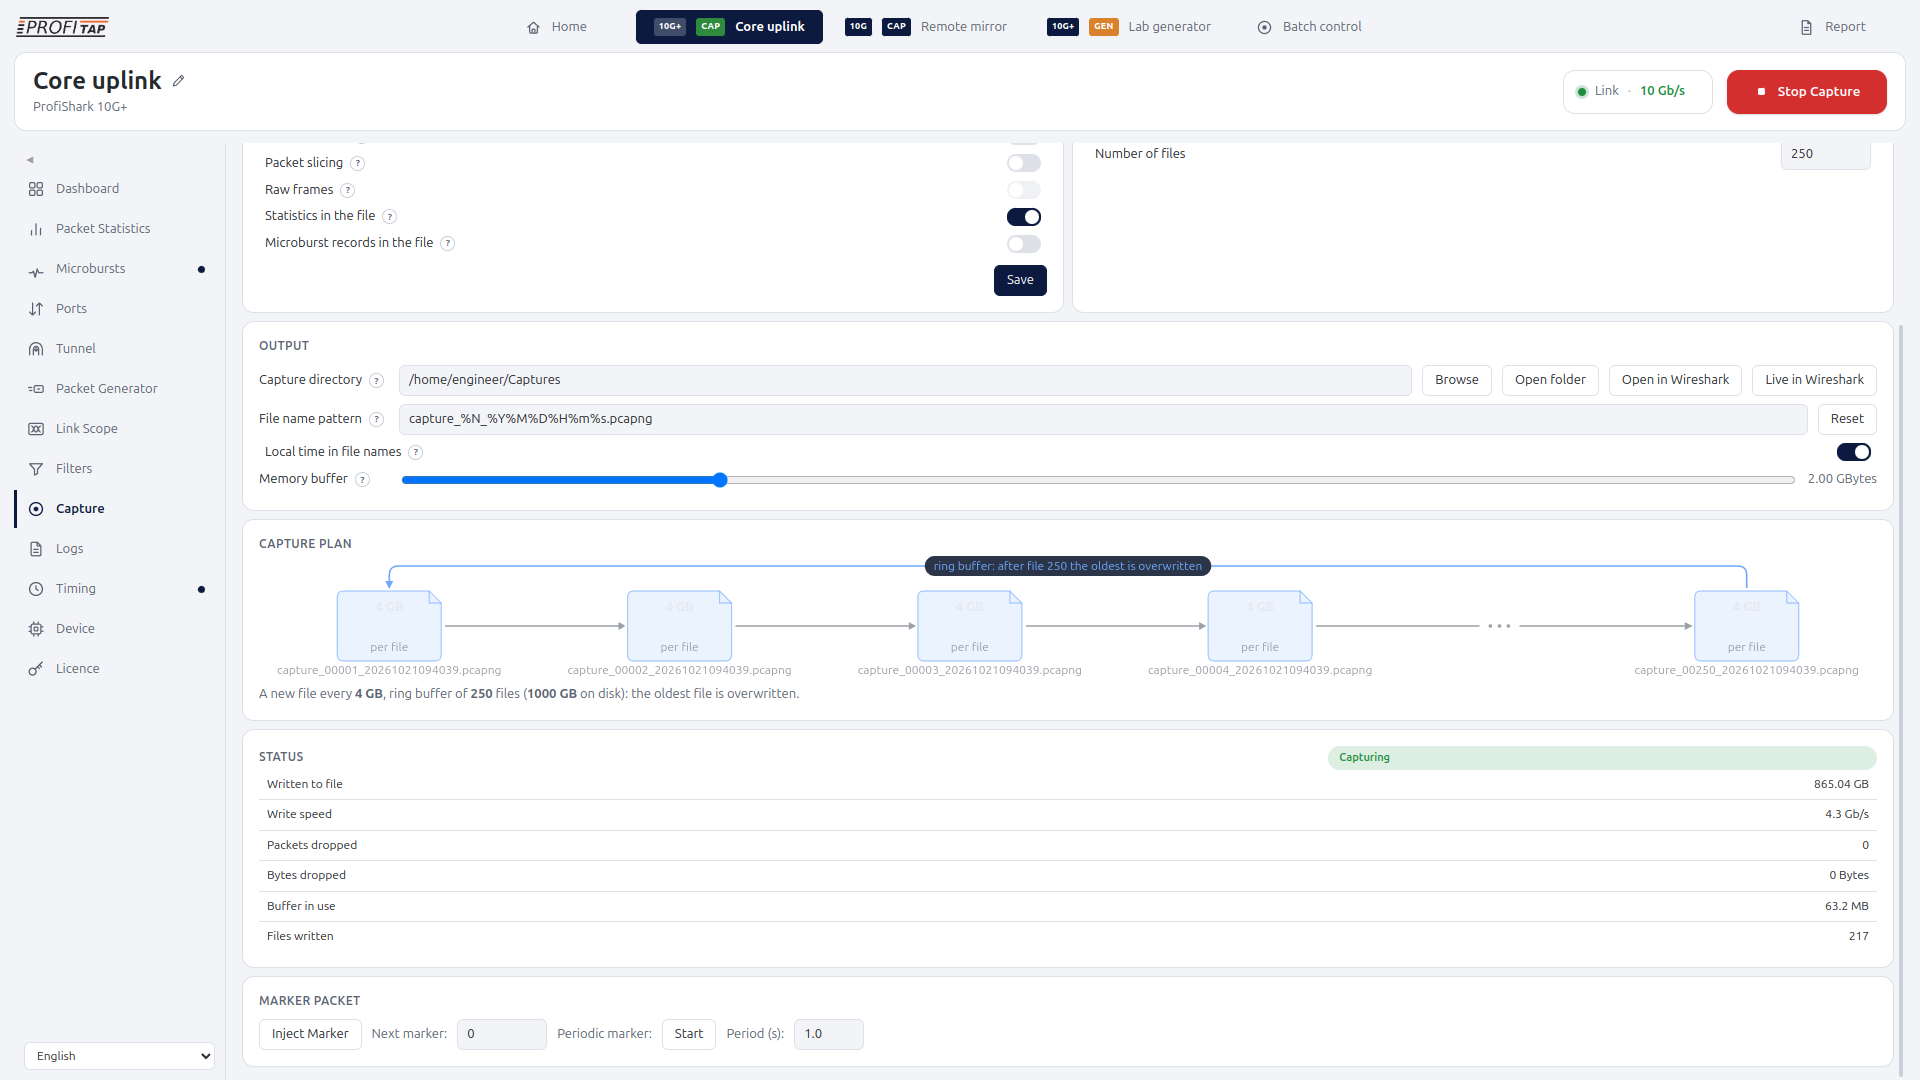
Capture
Build and visualize the capture plan, and record packet evidence, including custom blocks that contain packet statistics and capture status.
SFP / Port Diagnostics
Inspect module identity, supported diagnostics, and port speed.
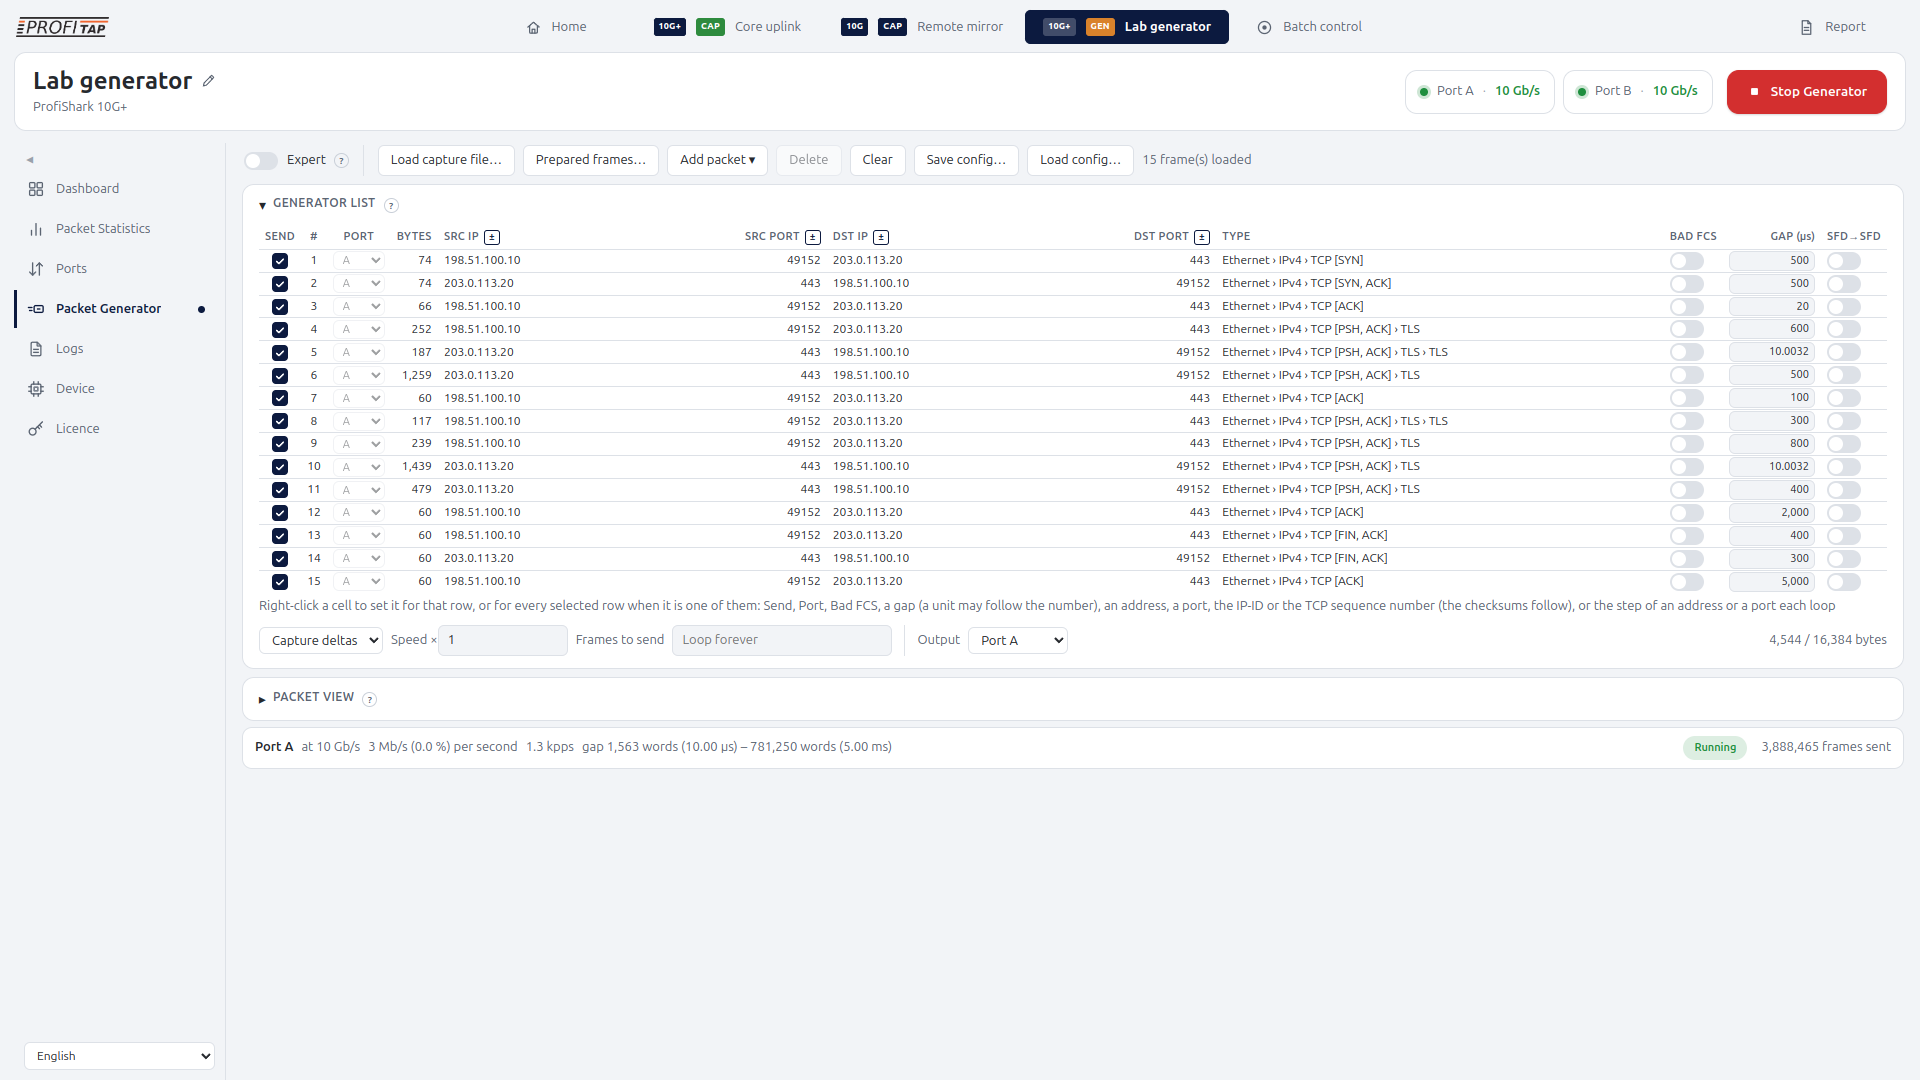
Line-rate traffic generationLicensed
Replay captured traffic, preserve recorded timing, generate controlled load profiles, and modify addresses or ports between repetitions.
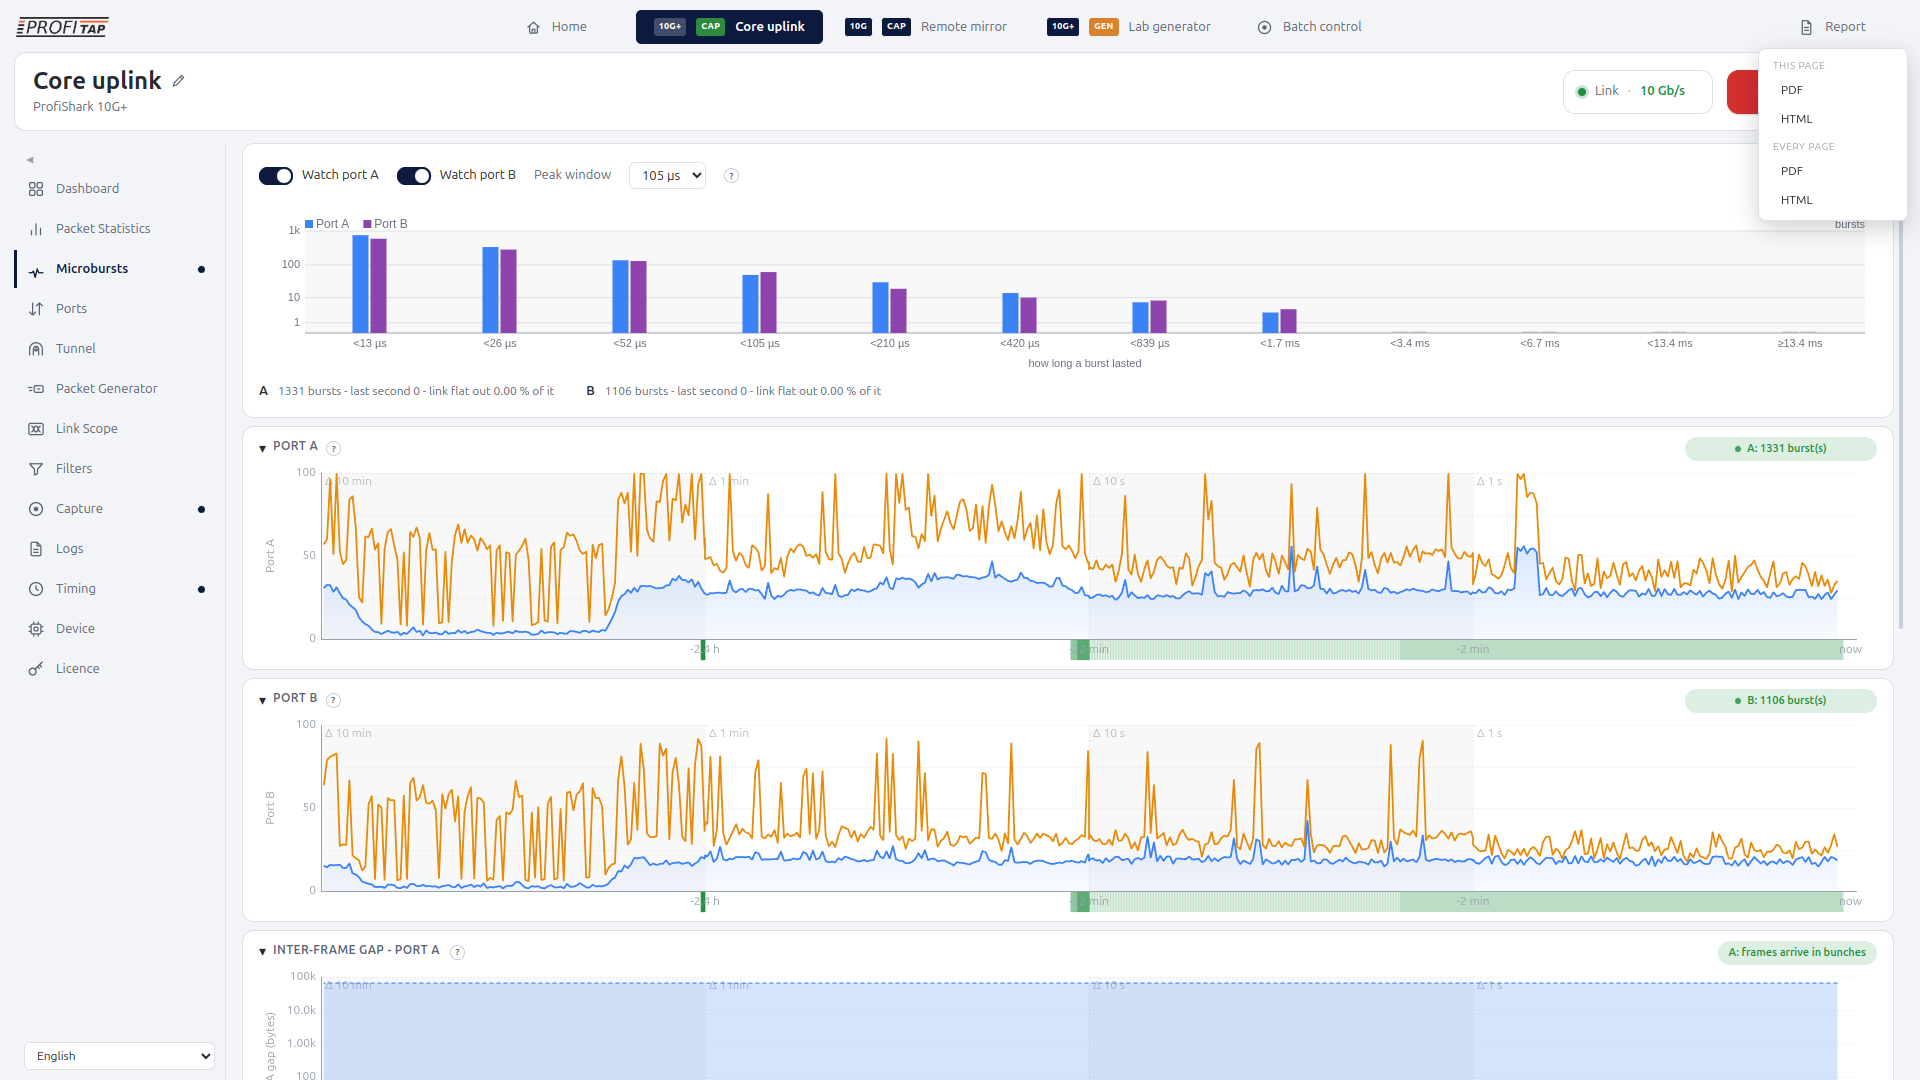
Microburst DetectorLicensed
Detect short congestion events, quantify backlog requirements, and identify the senders contributing to a burst.
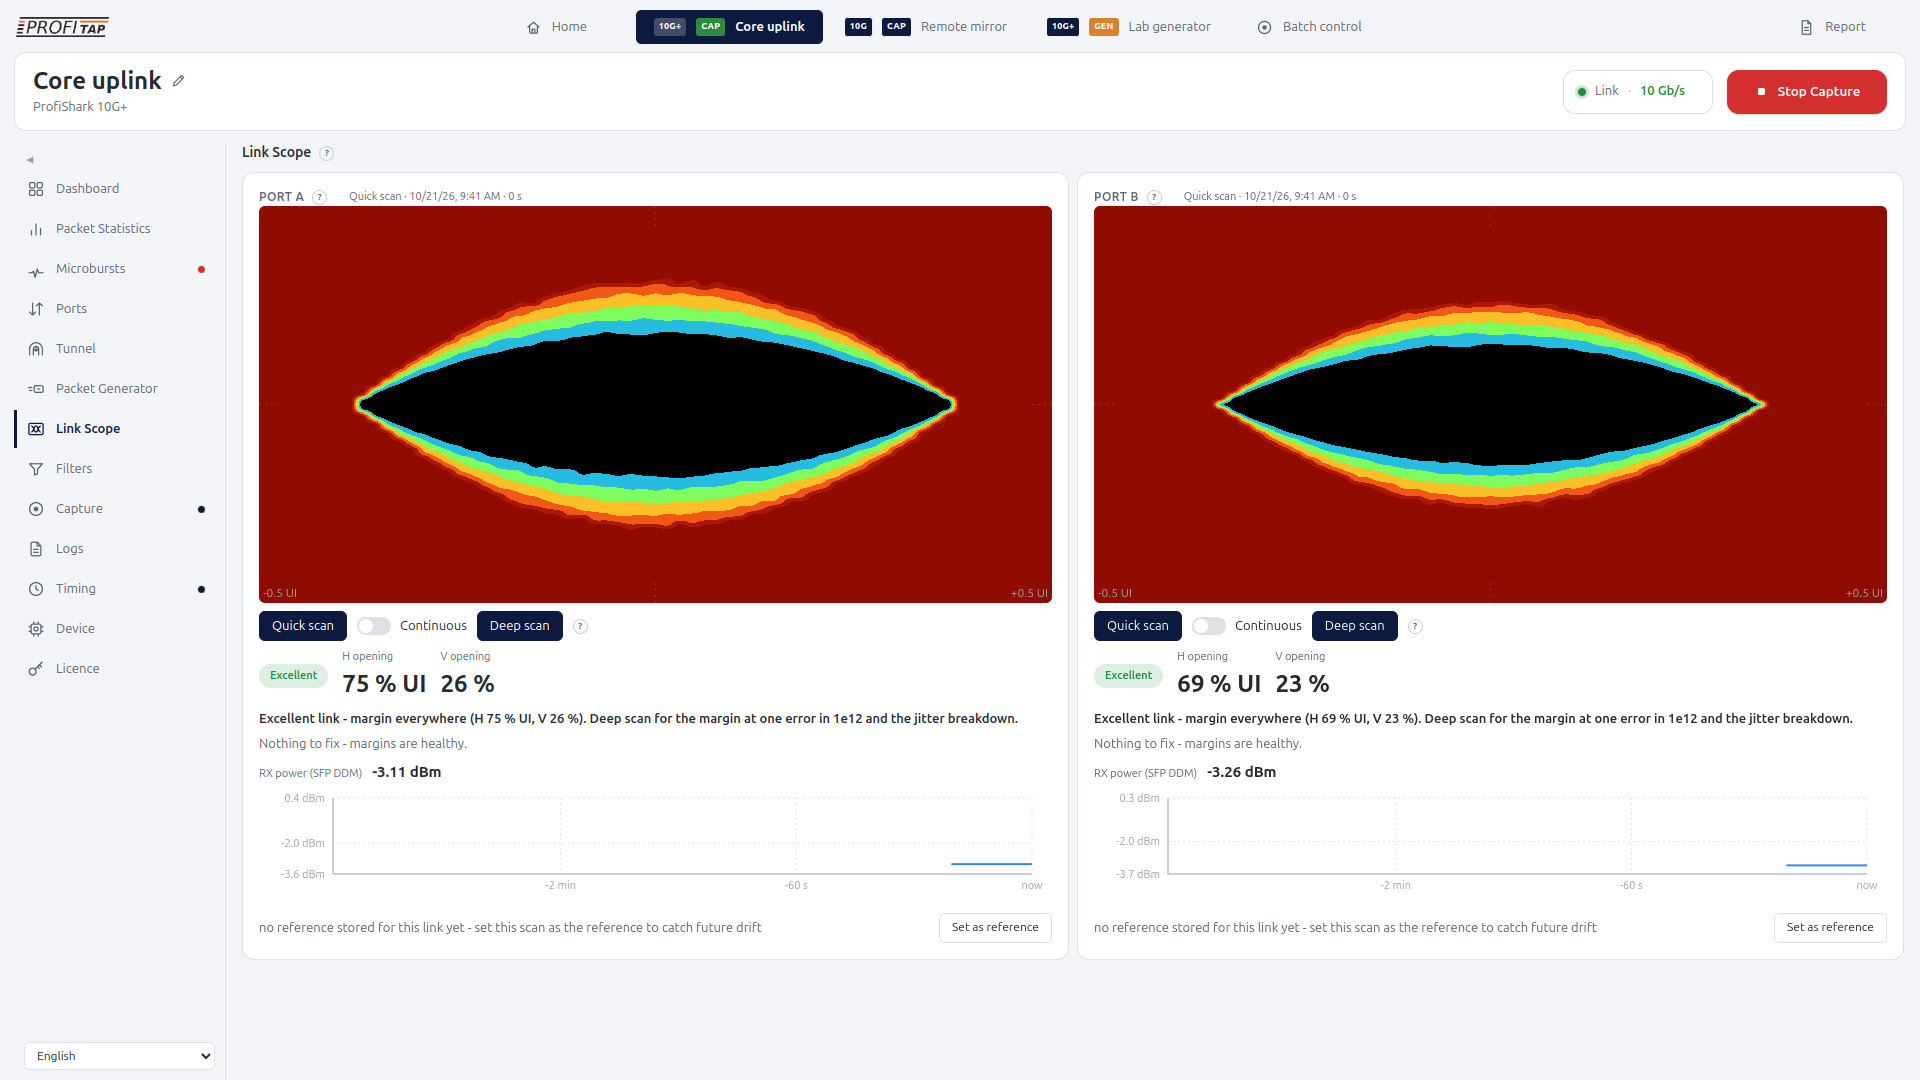
Link ScopeLicensed
Run quick, deep, or continuous signal-quality scans, including eye-diagram, jitter, BER, and optical-power analysis.
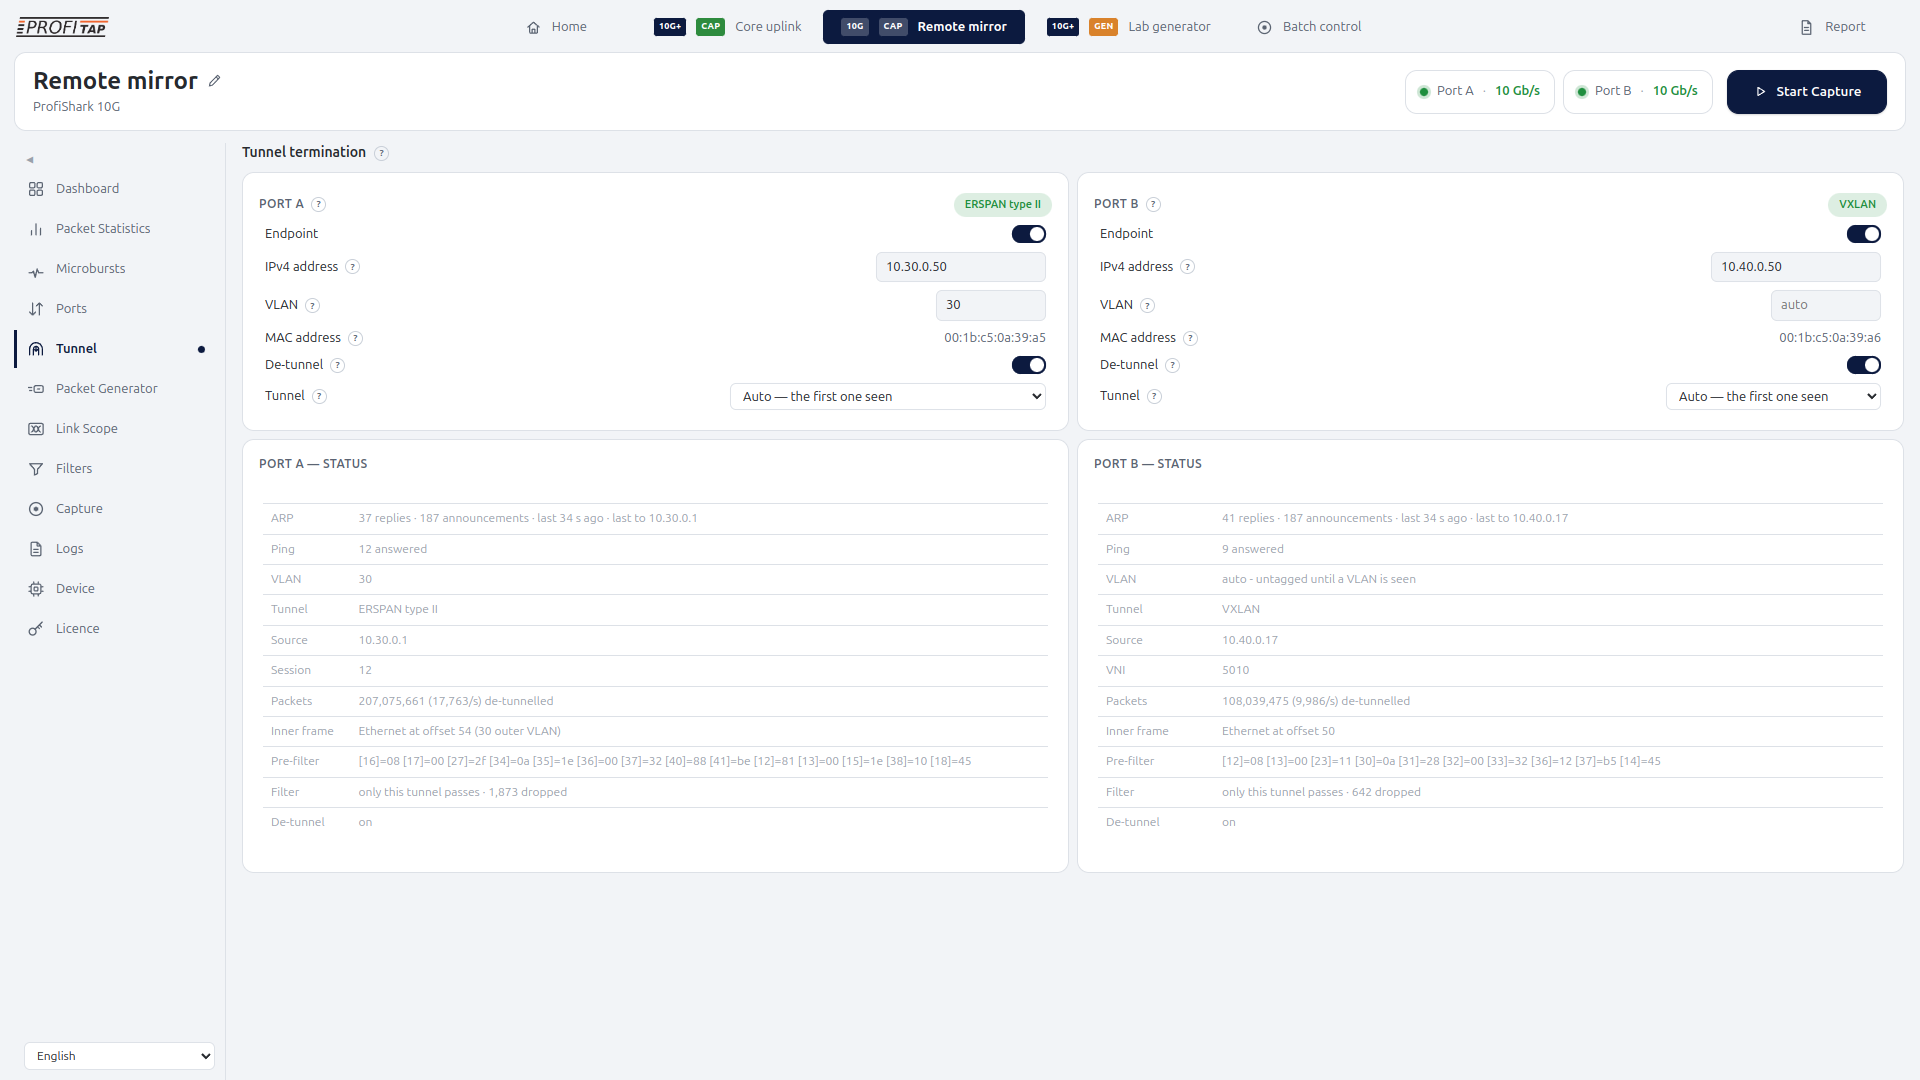
Tunnel TerminationLicensed
Terminate supported mirrored-traffic tunnels in hardware, so inner traffic can be filtered, captured, and analyzed at line rate.
Reporting
Create a PDF or web report from the standard and licensed pages available for the connected 10G+.
Typical applications
Distributed 1/10G troubleshooting with synchronized packet timing
Combine high-speed packet capture with GNSS or PPS synchronization when troubleshooting requires a common time reference across multiple measurement points.
High-speed packet correlation across systems or sites
Align packet events to an external time reference so captures can be correlated with other ProfiSharks, systems, logs, or measurements.
SFP and transceiver diagnostics
Inspect module identity and available diagnostics alongside packet and traffic measurements to determine whether the transceiver contributes to a network problem.
Transient congestion analysis with Advanced Packet Diagnostics
Use the Advanced Packet Diagnostics license microburst detection to expose short congestion events, measure their impact, and identify the traffic contributing to the burst.
Lab and device validation with line-rate traffic generation
Reproduce captured traffic or generate controlled line-rate loads to test downstream devices and validate behavior under repeatable conditions.
Signal-quality testing with Link Scope
Investigate eye quality, jitter, BER, and supported optical measurements while keeping signal diagnostics within the same synchronized troubleshooting workflow.
Remote mirrored-traffic capture through supported tunnels
Terminate supported mirrored-traffic tunnels in hardware and analyze their inner traffic while retaining the timing and capture capabilities of ProfiShark 10G+.
Long-term packet capture and forensics
Record synchronized high-speed packet evidence over time for intermittent investigations, post-event analysis, and correlation with measurements collected elsewhere.
Specifications
| Network technology | 1/10 Gb/s Ethernet over supported SFP/SFP+ modules |
|---|---|
| Network ports | 2 x SFP/SFP+ |
| Supported media | 1G and 10G copper and fiber SFP/SFP+ modules, no vendor lock |
| Monitoring modes | In-line and SPAN (out-of-band dual input) |
| Port speed | Automatic 1/10G SFP speed detection, manual selection available per port |
| Capture performance | 3.2 Gbps, 5 Mpps |
| Capture format | pcapng |
| Capture context | Device, interface, timing, capture settings, and per-port statistics are embedded alongside packet data |
| Capture modes | Live capture, direct capture to disk, long-term capture/ring buffer |
| Hardware capture options | Hardware filtering, deep packet inspection, packet slicing (0–65535 bytes) |
| Timestamping | 5 ns hardware timestamp at ingress |
| Traffic generation | Optional with Advanced Packet Diagnostics license: line-rate traffic generation and replay with configurable load profiles, preserved timing, and address/port modification. |
| Advanced time sources | GNSS UTC (GPS / Galileo / GLONASS), SNTP, internal RTC, external PPS |
| Timing connectors | 1 x SMA female (PPS), 1 x SMA female (GNSS antenna) |
| PPS | Input/output synchronization, cable correction up to 1000 ns |
| GNSS timing | Antenna delay compensation, typical GPS-linked synchronization precision ±32 ns |
| Port monitoring | Customizable real-time statistics, low-level error and bandwidth monitoring, per-port drop and CRC counters |
| Traffic statistics | Distinct IP addresses, MAC addresses, conversations, and VLANs |
| SFP diagnostics | Module identity and supported live diagnostics |
| Advanced Packet Diagnostics | Optional license: line-rate traffic generation, Microburst Detector, Link Scope, Tunnel Termination |
| Host connection | USB 3.0 |
| Power | USB 3.0; optional 5 VDC barrel jack input. Copper SFP/SFP+ modules require additional power via the DC input or supplied USB-to-DC cable. |
| Fail-safe note | SFP modules require power to operate; use an external TAP when a fail-safe in-line path is required. |
| Maximum network latency | 10 Gbps: 328 ns |
| Dimensions (WxDxH) | 105 x 124 x 26 mm / 4.13 x 4.88 x 1.02 in |
| Weight | 280 g / 0.62 lb |
| Software | ProfiShark Manager, Wireshark integration, CLI, reporting |
| Operating systems | Windows, Linux, macOS |
| System requirements | Dual Core processor, 4 GB memory, USB 3.0 port |
| Included accessories | GNSS antenna, USB 3.0 cable (1.8 m), USB A male to DC 5V adapter (1.5 m) |
| Compliance | RoHS, CE, UKCA, EAC |
| Order reference | C1AP-10G2 |
Thank you!
Your submission has been sent. If you want more information, solutions, and use cases, check out the links below:Did You Know?

FAQ
Where can I download ProfiShark software, drivers, and firmware?
ProfiShark Manager (includes drivers and firmware) for Windows and macOS is available from the ProfiShark software repository.
For Linux, ProfiShark Manager (.deb) and drivers are available from the Profitap APT repository. ProfiShark Manager (Flatpak) is also available from the ProfiShark software repository. The Linux setup instructions list the supported distributions and installation steps.
The ProfiShark Manager User Guide is available on our Knowledge Base.
What is the difference between ProfiShark 10G and 10G+?
ProfiShark 10G+ adds advanced timestamp synchronization – including GNSS and PPS – to the 1/10G capture and diagnostic workflow.
Which satellite constellations are supported?
The current timing workflow supports GPS, Galileo, and GLONASS.
Can ProfiShark 10G+ use an external PPS?
Yes. PPS input/output is supported, including cable-delay compensation up to 1000 ns.
Can each SFP port run at a different speed?
Yes. Each port can operate independently at 1 or 10 Gb/s, with automatic module-based detection or manual selection.
What is included with Advanced Packet Diagnostics?
The optional license adds Line-rate traffic generation, Microburst Detector, Link Scope, and Tunnel Termination.
Can ProfiShark 10G+ inspect SFP modules?
Yes. ProfiShark Manager reads module identity and supported diagnostics.
Can ProfiShark Manager create reports for 10G+?
Yes. Reporting is available through ProfiShark Manager and can include timing, capture, statistics, SFP diagnostics, and any licensed diagnostic pages available on the device.
Can I analyze captures in Wireshark?
Yes. ProfiShark 10G+ integrates with Wireshark and other compatible packet analyzers.
Related products
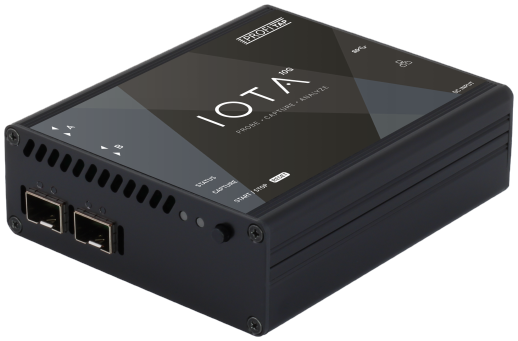
IOTA 10G
A multifunctional passive network probe with integrated traffic capture and analysis capabilities.
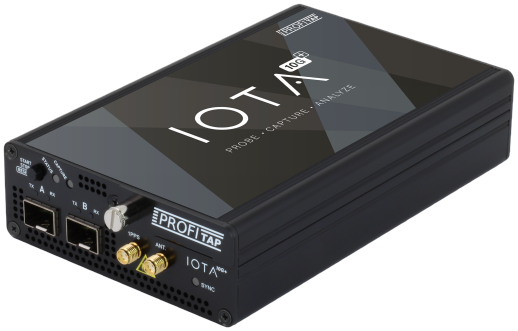
IOTA 10G+
A multifunctional passive network probe with integrated traffic capture and analysis capabilities.
ProfiShark 1G+
Gigabit packet capture and link diagnostics with GPS/Galileo/GLONASS and PPS advanced timestamp synchronization.