
Trusted for over 15 years by experts in critical networks worldwide.


Accurate field packet capture
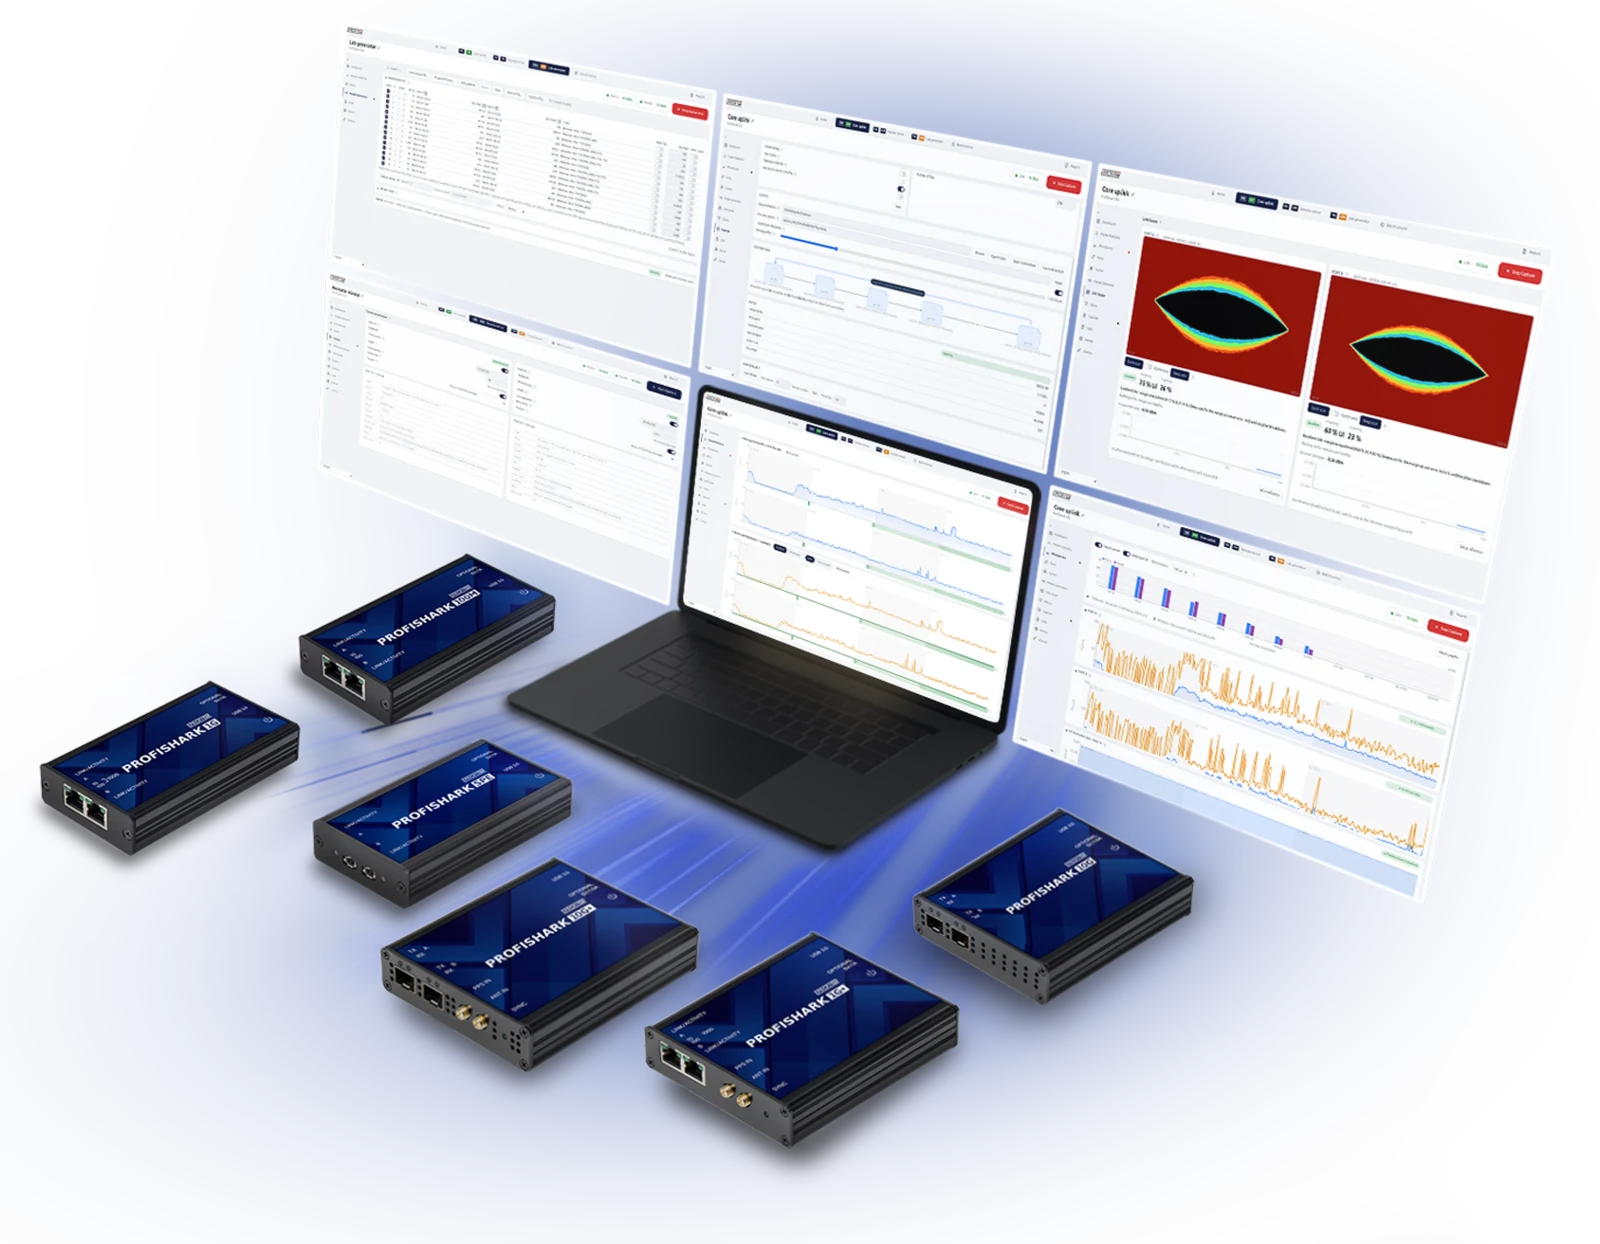
ProfiShark is a purpose-built network capture and diagnostics tool for engineers who need reliable, packet-level visibility directly from the wire. Lossless capture and accurate hardware timestamping provide the foundation for trustworthy packet sniffing, timing analysis, and root-cause investigation.
From CRC errors and problem hosts to cable faults, microbursts, signal quality, and traffic replay, ProfiShark gives engineers the evidence and diagnostic tools they need to understand what happened, reproduce the issue, and validate the fix.
Four outcomes with ProfiShark
- Capture reliable evidence
- Capture packet-level evidence directly from the wire while checking the physical link at the same time. ProfiShark helps engineers determine whether an issue starts with the traffic, the connection, or the network hardware itself.
- Reproduce and validate
- Use traffic generation and replay to recreate network conditions, reproduce difficult issues, and verify that changes or fixes behave as expected.
- Trust the timing
- Accurate hardware timestamping gives every packet a reliable point in time. On supported models, GPS/Galileo and PPS synchronization enable precise correlation across systems and measurement points.
- Analyze your way
- Use ProfiShark Manager for diagnostics and traffic analysis, or bring captures directly into Wireshark and your existing workflow for deeper packet-level investigation.
One workflow from symptom to fix
-
Observe
Use the ProfiShark Manager to investigate link state, traffic, device health, capture status, and active diagnostics.
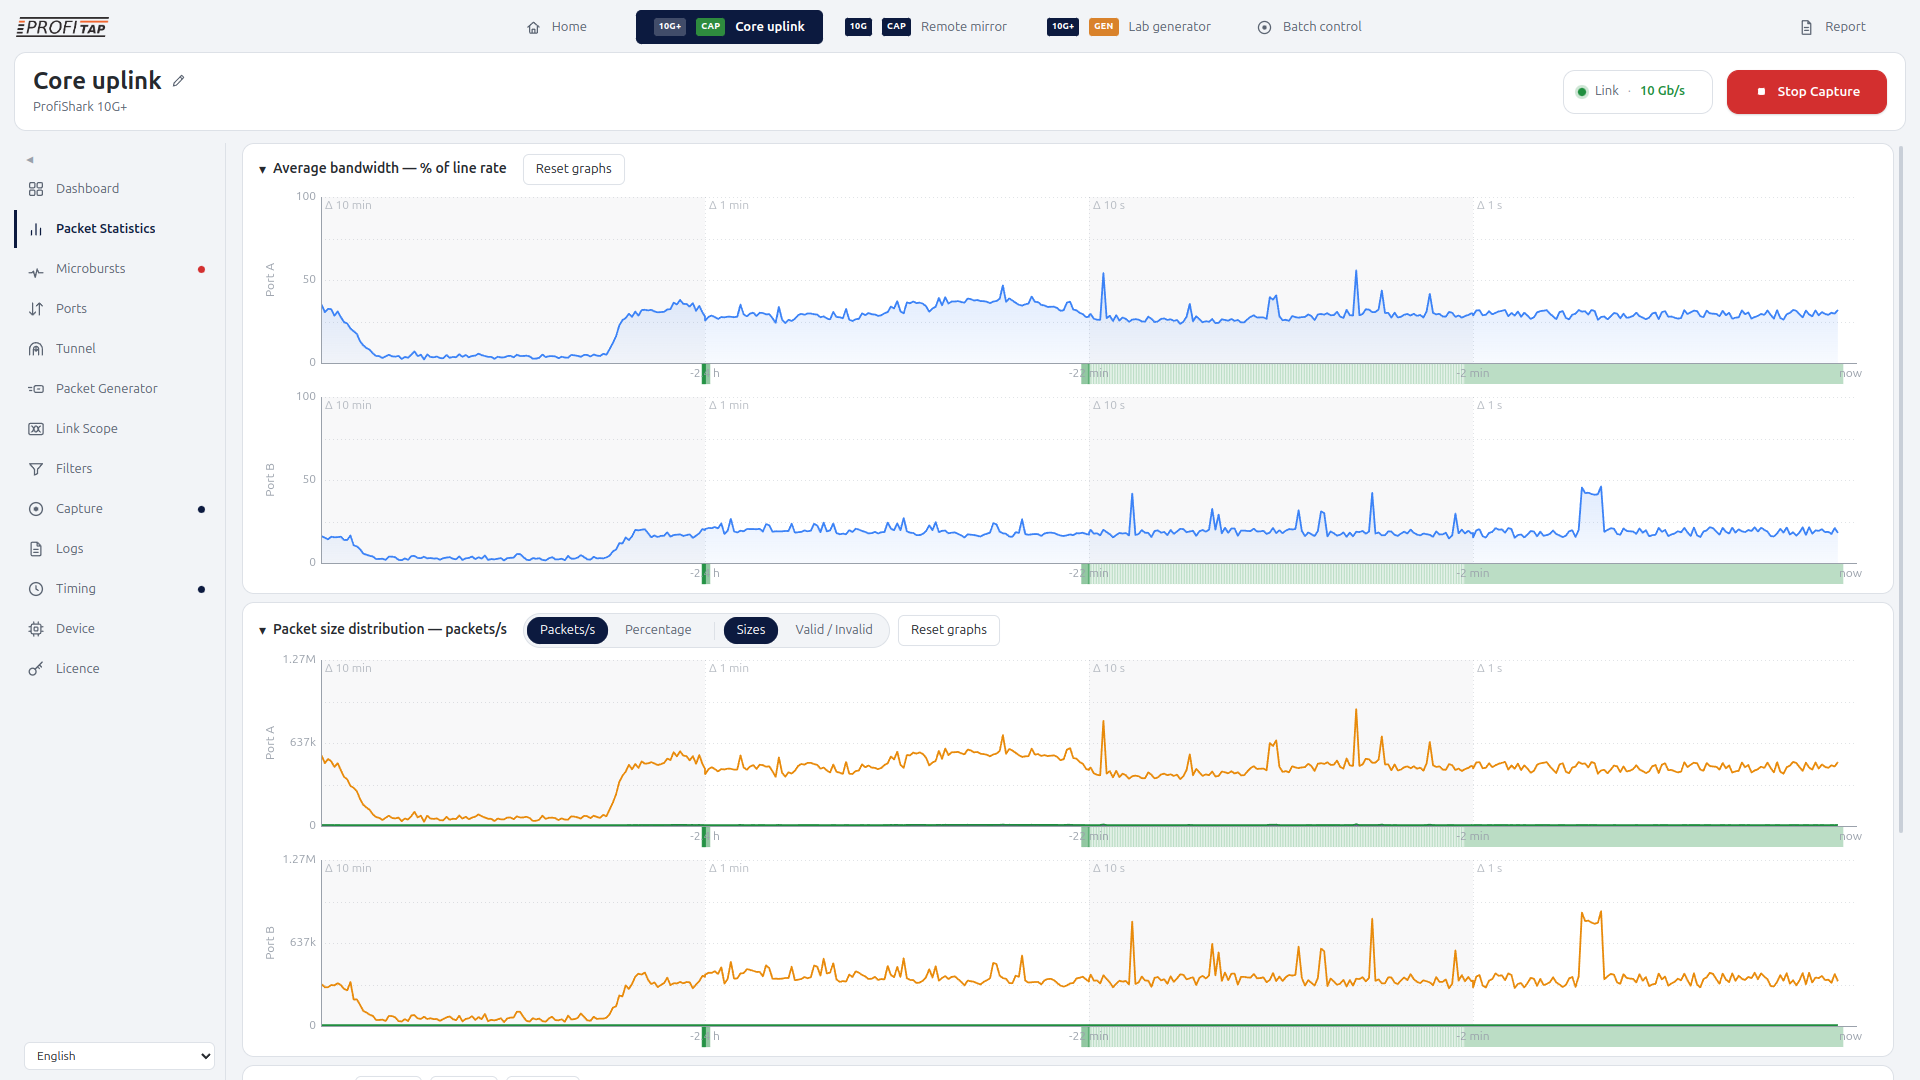
Explore packet statistics across recent and historical periods, identify microbursts, monitor packet errors and inter-frame gaps, and watch changes in address, conversation, and VLAN diversity over time.
ProfiShark Manager retains up to 24 hours of history across its charts, allowing an event that occurred seconds ago to be examined alongside behavior from earlier in the day.
Notifications highlight new conditions such as damaged frames, dropped packets, recorded microbursts, or a failed self-test without interrupting the investigation.
-
Identify
Find out what actually changed. Examine cabling, link negotiation, signal quality, EEE behavior, SFP information, and traffic composition to eliminate possible causes.
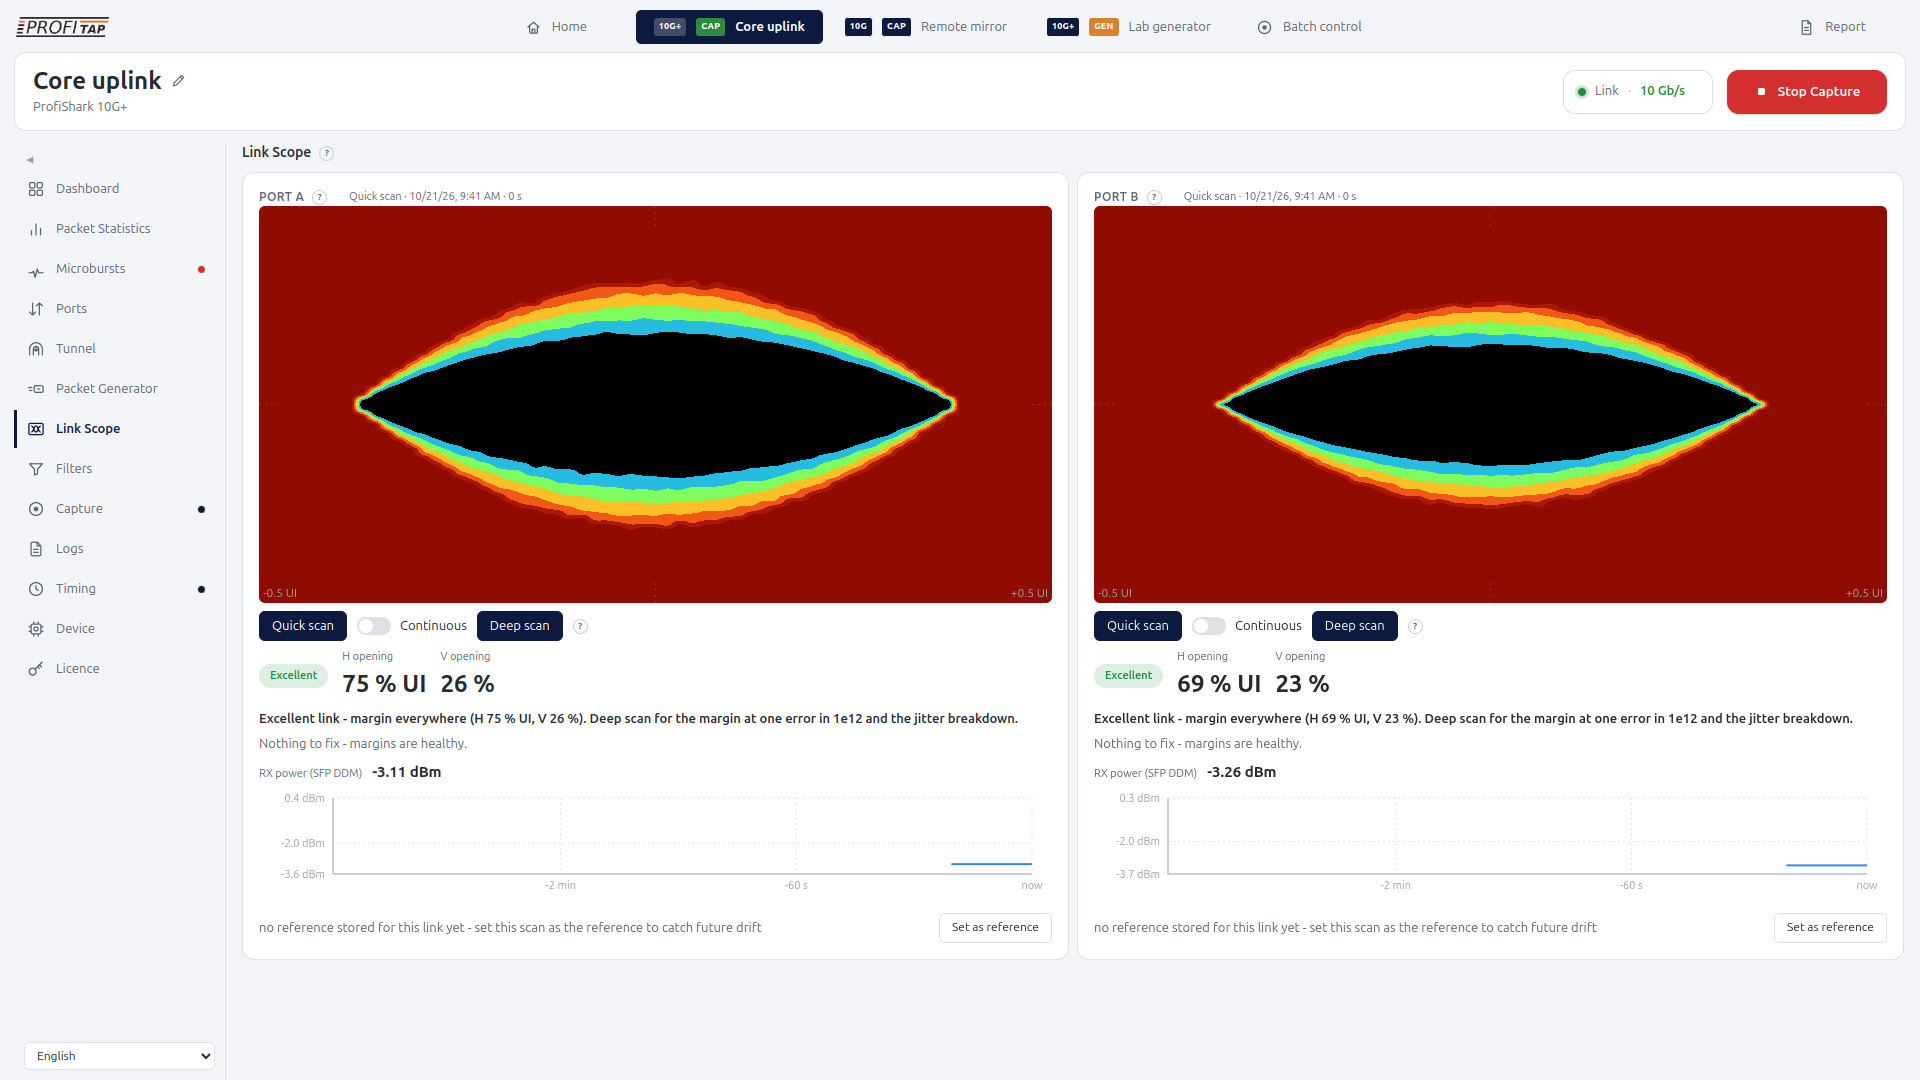
On ProfiShark 10G and 10G+, Link Scope can perform quick, deep, or continuous signal-quality scans and compare a link against a stored known-good reference.
When mirrored traffic arrives via VXLAN, ERSPAN, GRE, IP-in-IP, or other supported encapsulations, ProfiShark can terminate the tunnel in hardware and analyze the inner traffic rather than treating the encapsulation as part of the problem.
-
Capture
Capture directly from the wire with high-precision hardware timestamps.
Unlike SPAN ports or laptop capture, ProfiShark provides reliable traffic capture on your PC without disrupting the network. Captures include custom blocks with device, link, clock, filter, and per-port statistics, preserving useful context for later analysis or sharing.
Features like capture file rotation, maximum file size or clock-aligned capture boundaries allow precise long-term capture. A tight integration with Wireshark allows for deeper diagnosis, retaining all metadata gathered during the capture.
-
Reproduce & validate
Replay captured traffic, reproduce original timing, and, on supported models, even exact low-level frame characteristics. Generate traffic to load a link or device and verify whether remediation actually solved the problem.
The Advanced Packet Diagnostics license on supported models allows ProfiShark to generate traffic at wire speed with configurable load profiles and frame variations. Raw replay can reproduce preambles, start delimiters, FCS, fragments, runts, and supported preemption traffic that a standard NIC cannot normally send.
Advanced Packet Diagnostics
Supercharge your network diagnostics
On top of the base traffic capture and diagnostics features, ProfiShark offers advanced packet analysis and diagnostics right when you need them. Activate the Advanced Packet Diagnostics license directly within ProfiShark Manager to accelerate troubleshooting and turn difficult network conditions into clear, repeatable evidence.
The license brings together four advanced capabilities on ProfiShark 10G and 10G+:
- Traffic Generator: Line-rate traffic generation, capture replay, shaped loads, address and port variation, and low-level frame testing.
- Microburst Detector: Hardware detection of short bursts, with burst timing, peak backlog, and sender information.
- Link Scope: Eye-diagram and signal-quality measurements, including deeper jitter and bit-error-rate analysis.
- Tunnel Termination: Hardware termination of supported mirrored-traffic tunnels so the inner traffic can be captured and analyzed.
Traffic Generator
Traffic capture and generation
Capture the incident. Then make it happen again.
Finding an intermittent fault once shouldn't mean waiting for it to happen twice.
ProfiShark 1G, 1G+, and SPE support packet generation with configurable frame lengths, rates, and counts.
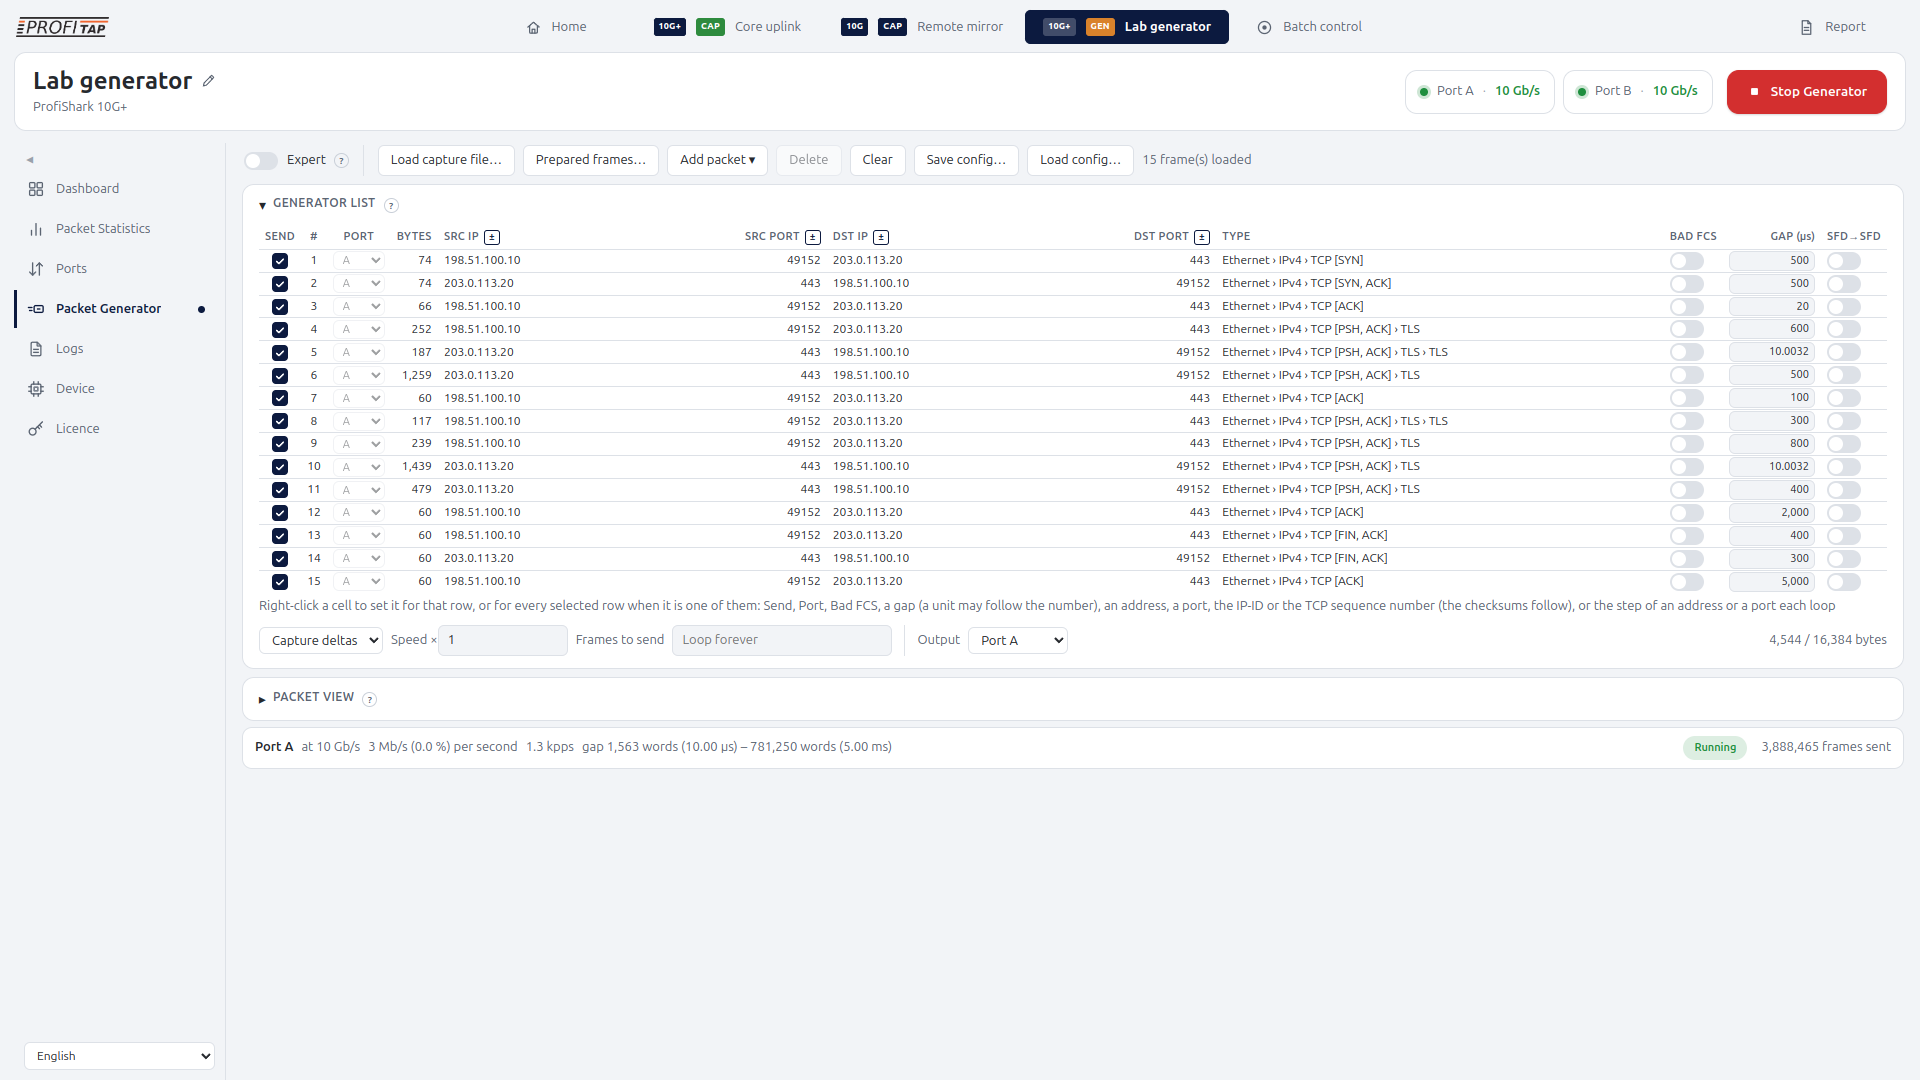
ProfiShark 10G and 10G+ support line-rate traffic generation, enabling users to:
- Generate line-rate traffic while preserving inter-frame timing
- Replay preambles, delimiters, FCS, malformed frames, fragments, runts, and more
- Select only specific frames for replay
- Manipulate parts of the packets like MAC or IP addresses or TCP / UDP ports with automatic checksum recalculation for further test scenarios
- Apply various profiles that affect load and jitter of the generated stream
- Align traffic generation with GPS or external PPS timing on supported models
- Create Traffic Generator configurations and share them with others to quickly investigate issues together
Predefined frame sets cover various network and traffic scenarios (e.g. jumbo frames, PRBS, VoIP, VLAN/QinQ, PTP and many others).
Microburst Detector
Microburst analysis
A link can be “30% utilized” and still be dropping packets
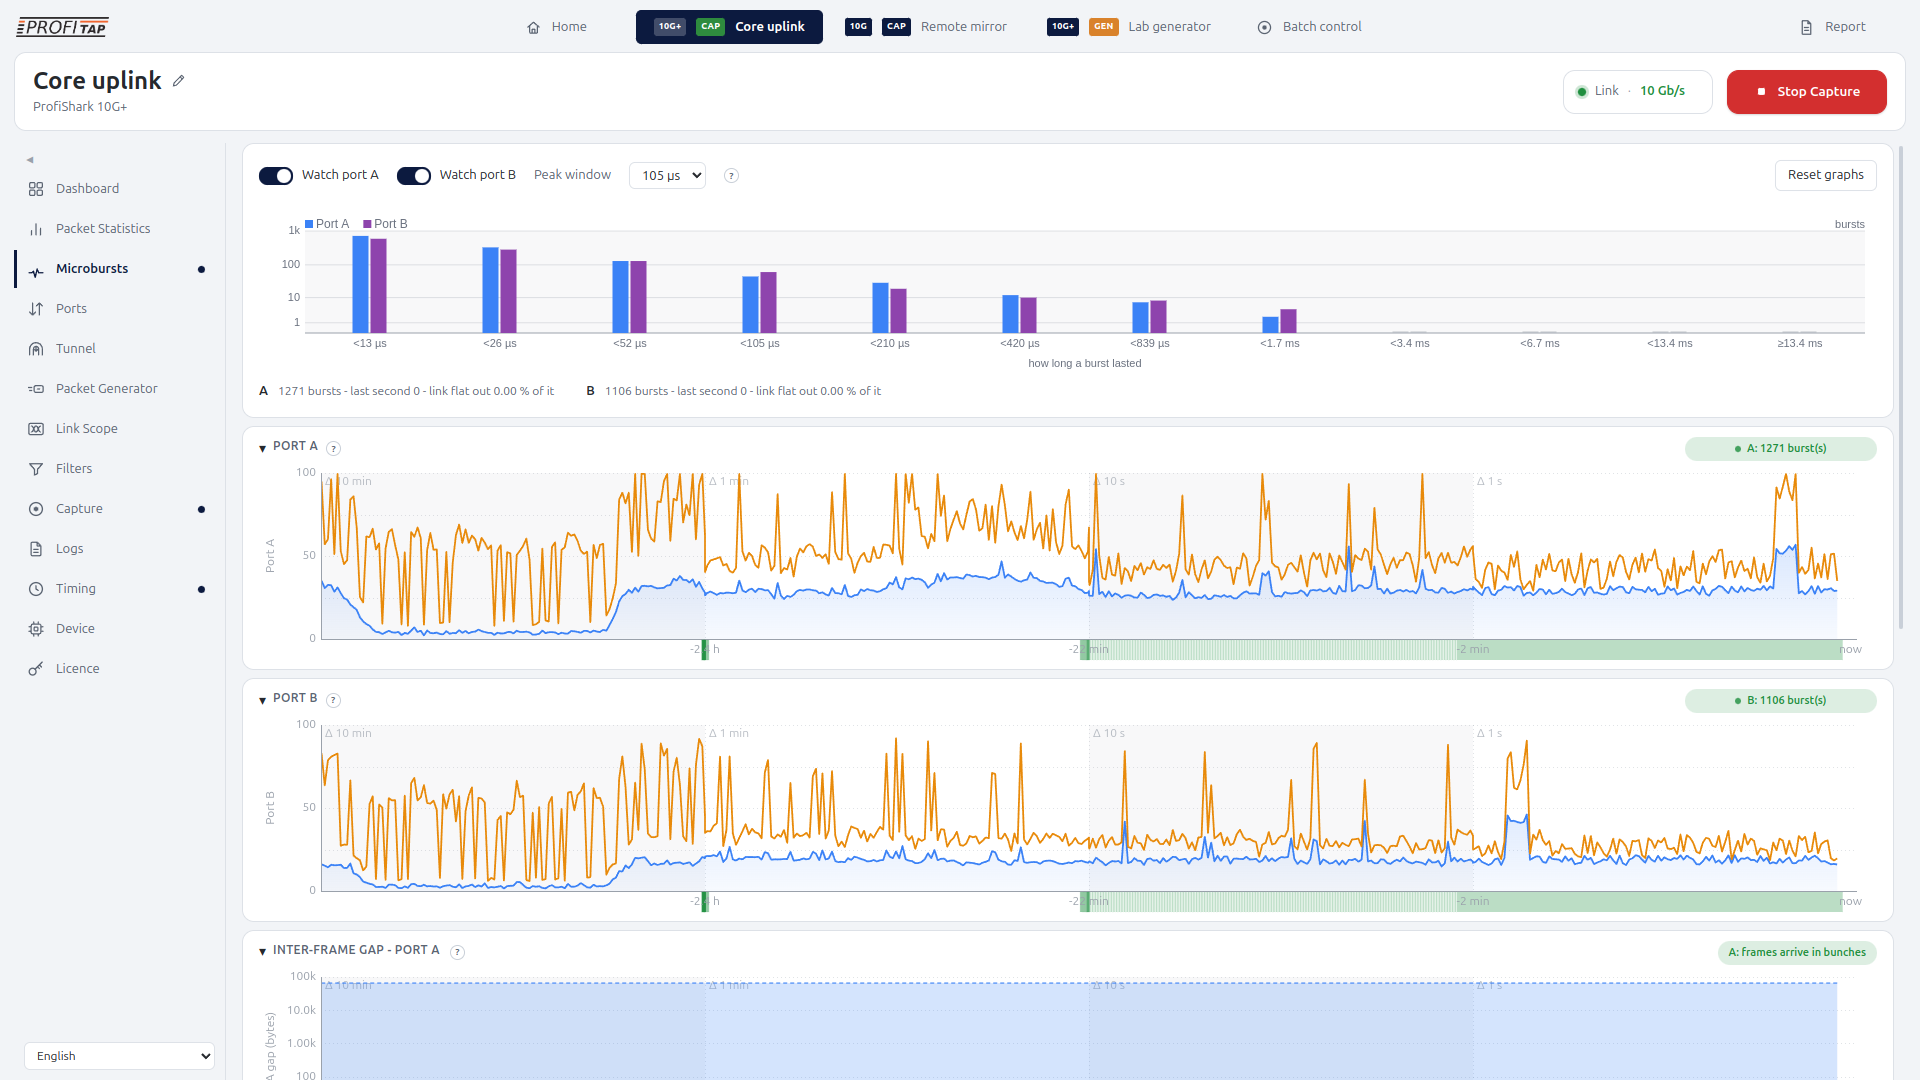
Traditional bandwidth graphs average traffic across relatively long intervals. A short burst can fill a switch or NIC buffer and disappear inside that average.
ProfiShark 10G and 10G+ can detect microbursts directly on the wire without requiring engineers to define a threshold first.
Each physical port is monitored independently. At 10 Gb/s, bursts can be detected down to 10 microseconds, with burst duration, peak backlog, and time spent at line rate recorded by the hardware.
Instead of simply concluding that “there was congestion”, you can identify the source, such as determining that a specific host generated the burst or that the link itself is oversubscribed, leading to faster root-cause isolation and reduced time spent investigating healthy applications, servers, and switches.
Link Scope
Physical link diagnostics
Test link quality before changing hardware
Physical faults are remarkably good at masquerading as network or application problems. With ProfiShark, engineers can inspect:
Cable Diagnostics
On supported 1G models and ProfiShark SPE, cable diagnostics can run while the link remains active. ProfiShark can report the length of each pair, the distance to a fault, the wiring state, the negotiated role, the link-partner capabilities, and signal quality without taking the segment out of service.
Link Scope
On ProfiShark 10G and 10G+, Link Scope brings signal-quality analysis into the same diagnostic workflow. A quick scan provides an immediate assessment, while a deep scan measures the eye and bathtub curve to evaluate jitter and extrapolated bit error rate against the Ethernet link budget.
Tunnel Termination
Capture mirrored traffic without host-side decapsulation
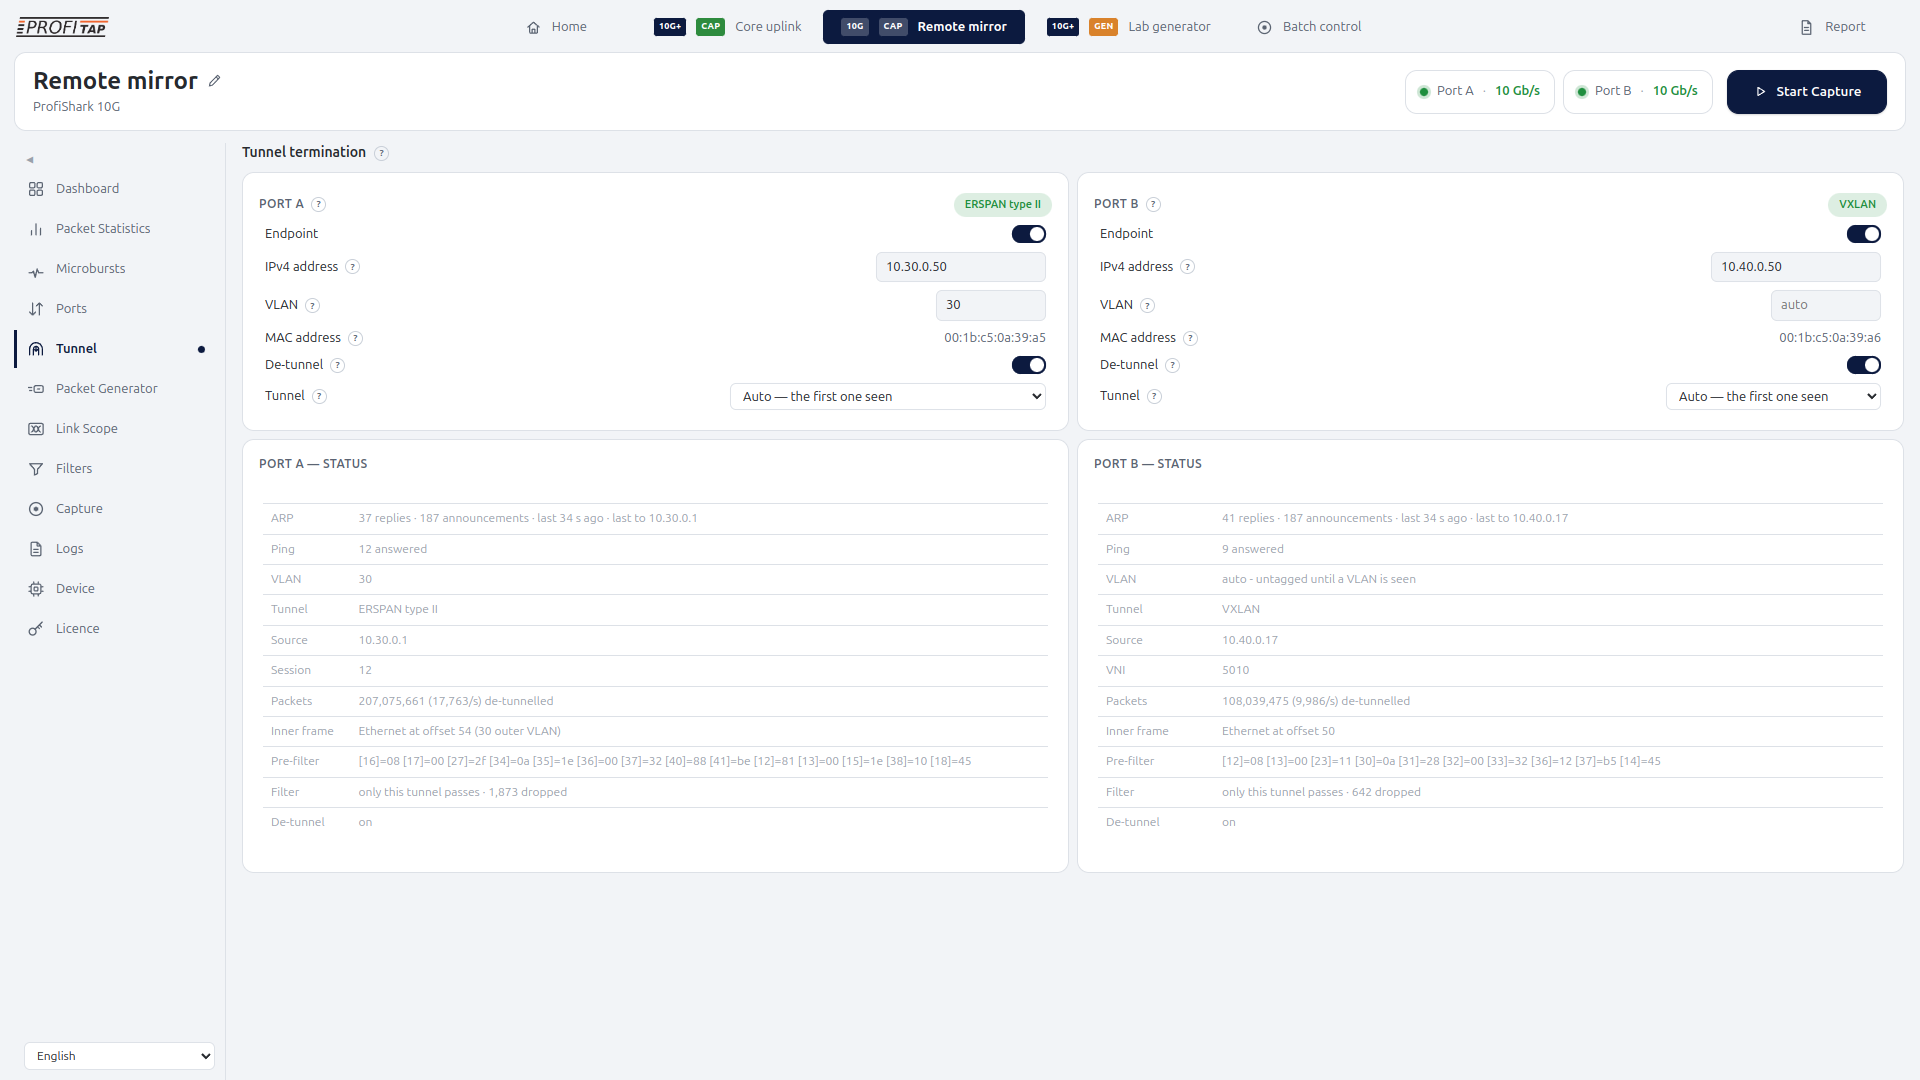
ProfiShark 10G and 10G+ can be configured as tunnel endpoints to better integrate into existing network analysis infrastructures. Supported encapsulations include VXLAN, ERSPAN types II and III, GRE over Ethernet, IP and IPv6, IP-in-IP, and IPv6-in-IP. Various information about tunnels is captured additionally as statistics.
Tunnel decapsulation occurs in hardware at line rate, allowing the host to analyze encapsulated traffic as if it were injected directly into the link, including all capture capabilities such as capture filters and high-precision timestamps.
Capture evidence with context
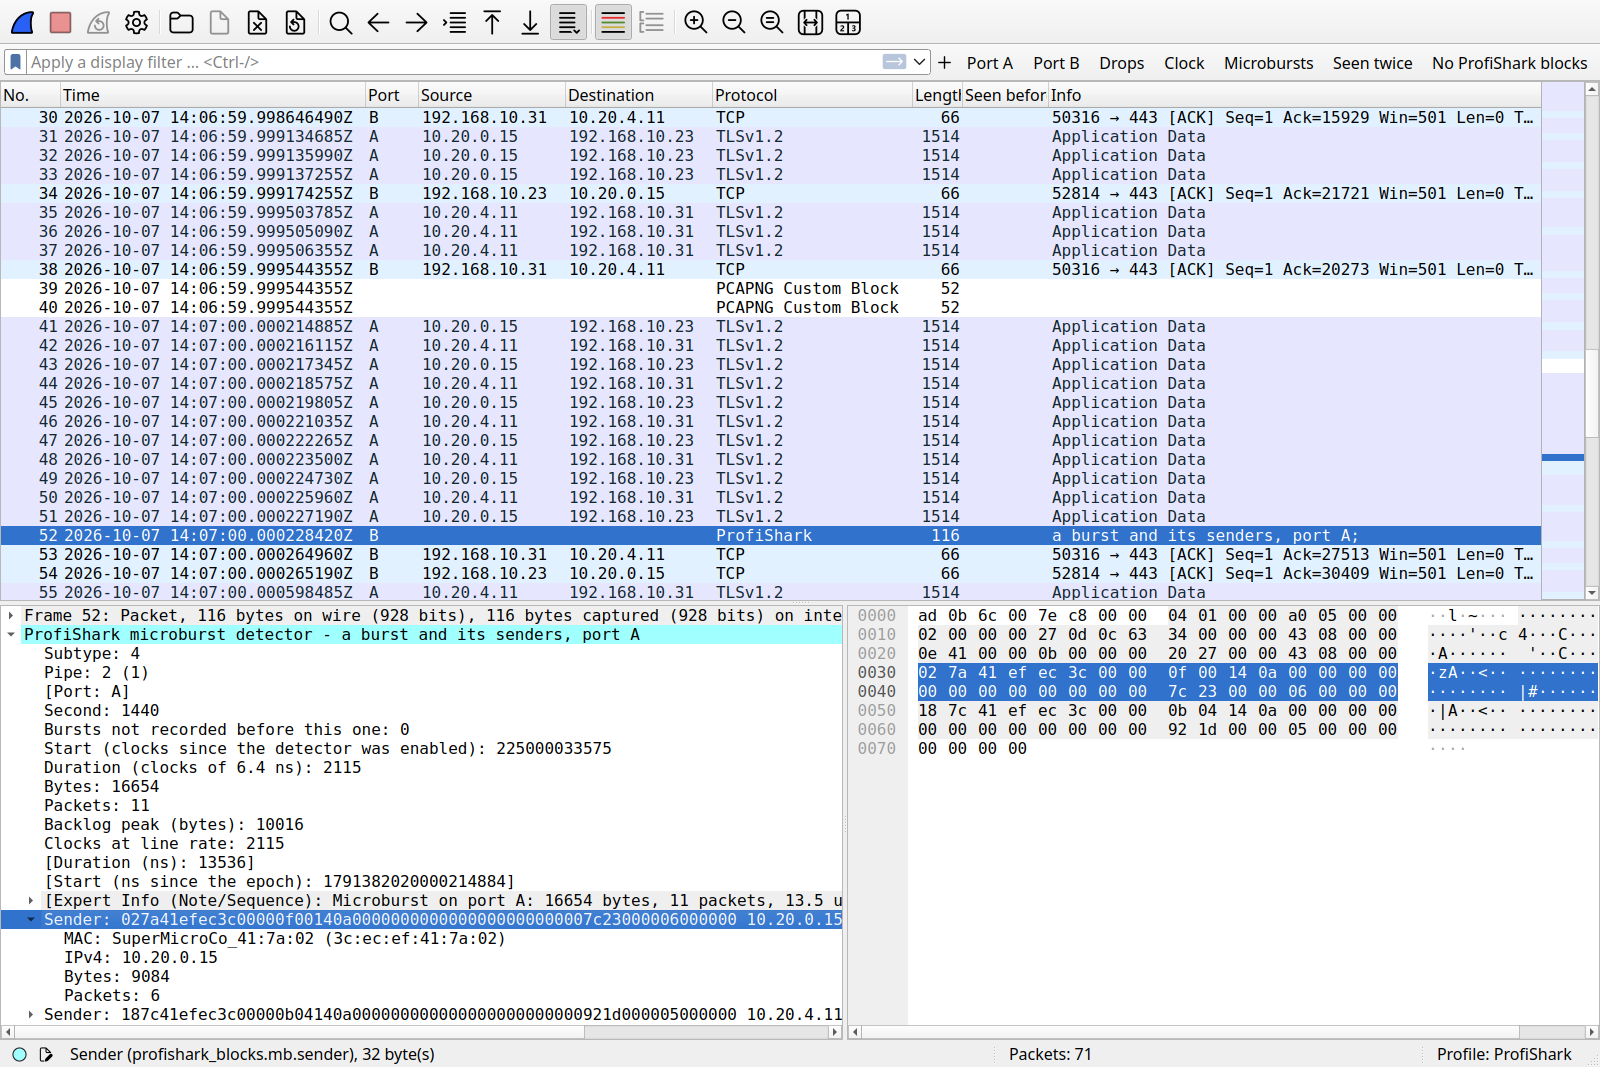
When troubleshooting network issues later, a packet capture becomes significantly more actionable if it includes the original recording conditions. ProfiShark enhances packet captures with diagnostic context collected alongside the traffic in custom blocks, helping engineers understand not only what was captured, but under which conditions.
Capture information can include hardware timestamps, clock synchronization status, device and interface identifiers, capture settings, detailed per-port frame statistics, and diagnostic data such as microburst events.
This allows easy delivery and propagation of the captured information (e.g. for Wireshark analysis or hand-over to a colleague) as metadata and packet information always stay together.
ProfiShark Manager
ProfiShark Manager brings capture and diagnostics together on Windows, Linux, and macOS. Multiple ProfiSharks can be managed from the same application and allow an engineer quickly start the analysis:
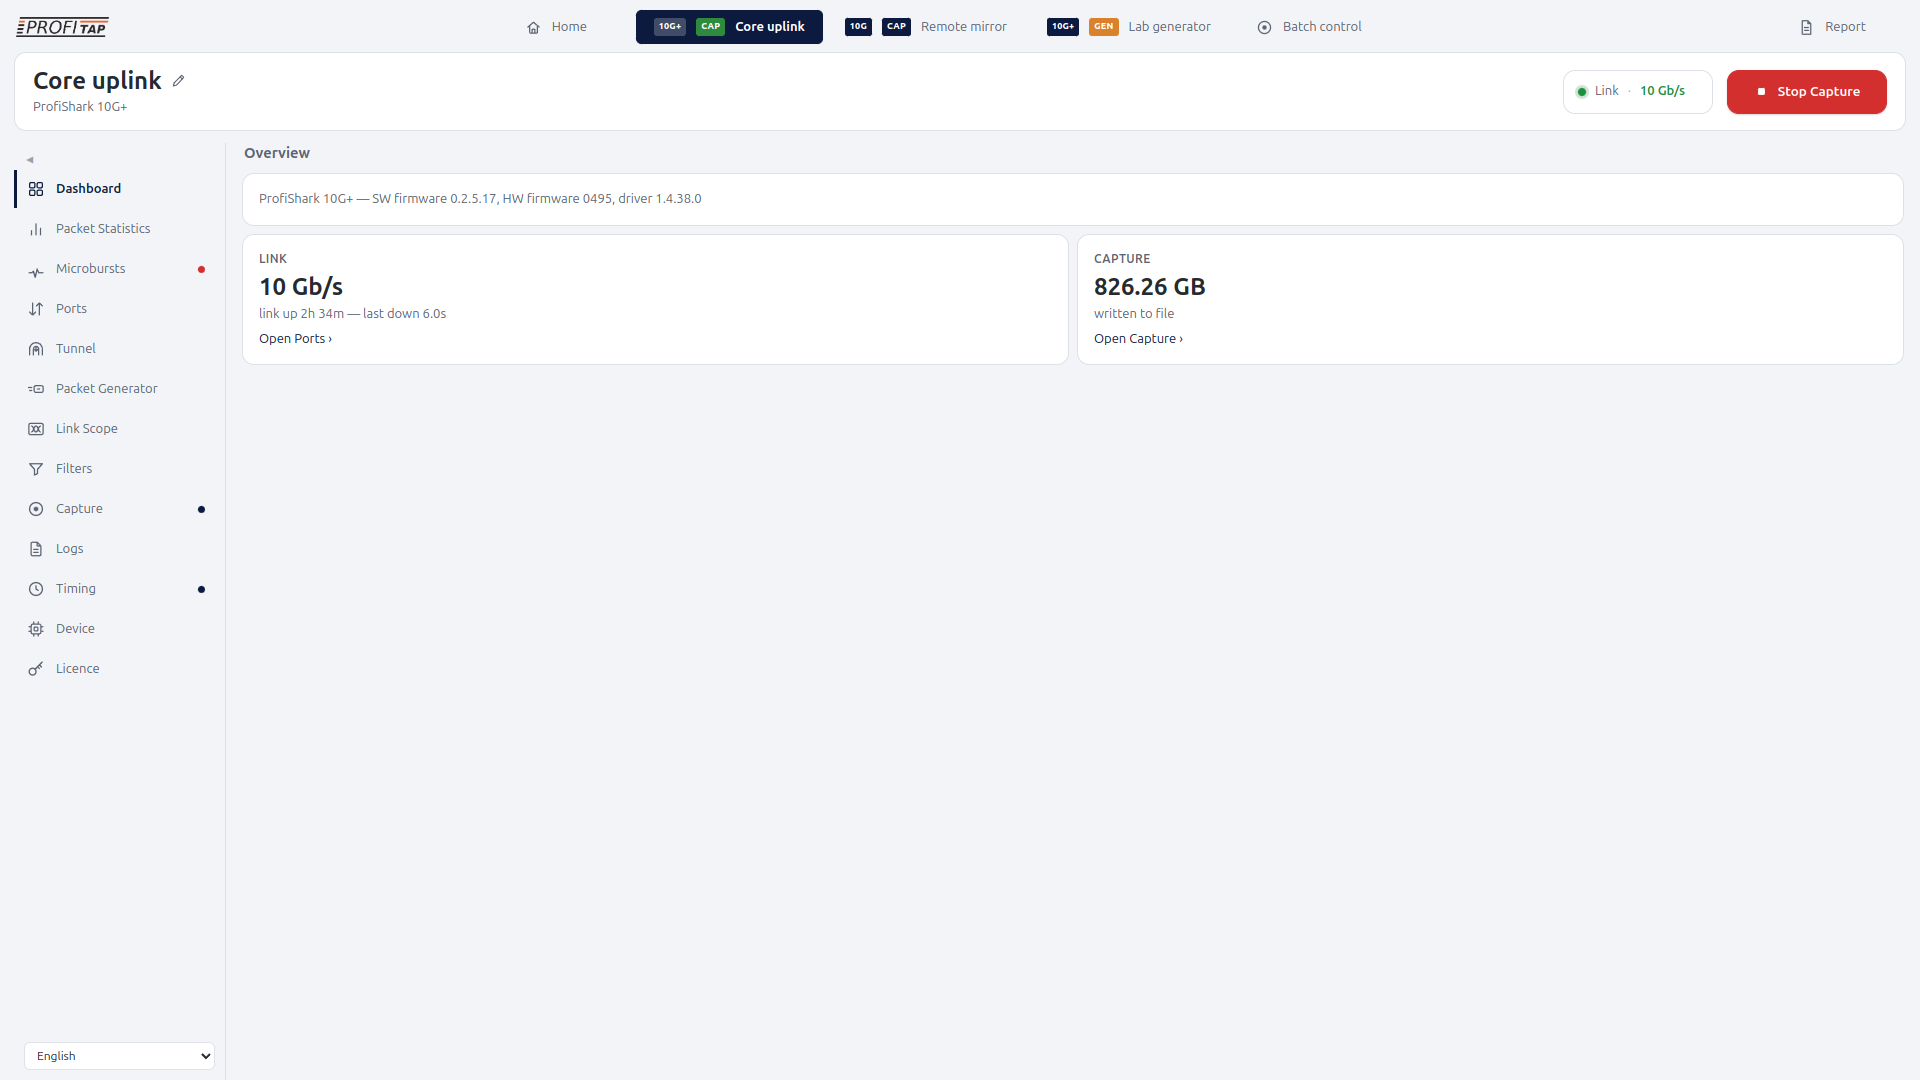
Overview Dashboard
Link state, traffic, capture status, and device health at a glance.
Packet Statistics
Detailed recent measurements and longer history in the same view.
Microbursts
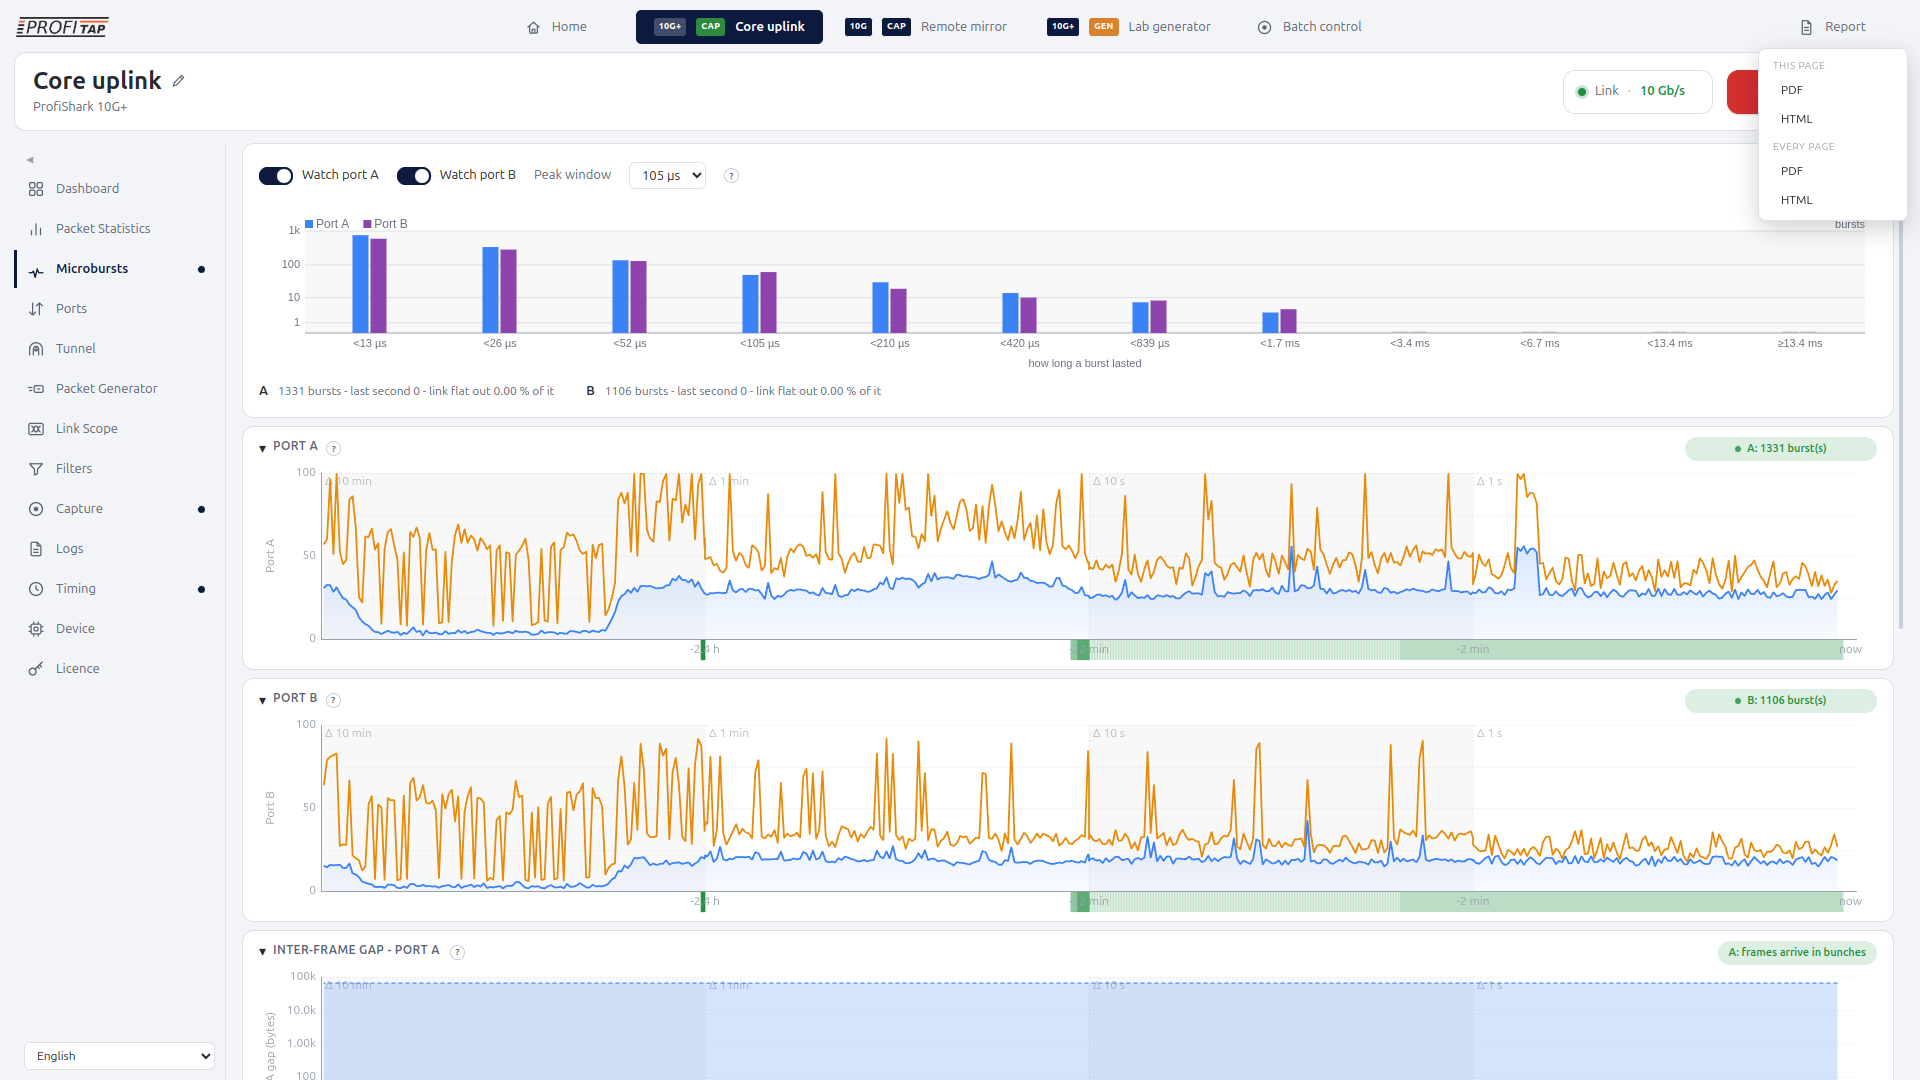
Inspect the burst timeline, severity, buffering requirement, source, inter-frame gaps, and related traffic conditions.
Capture
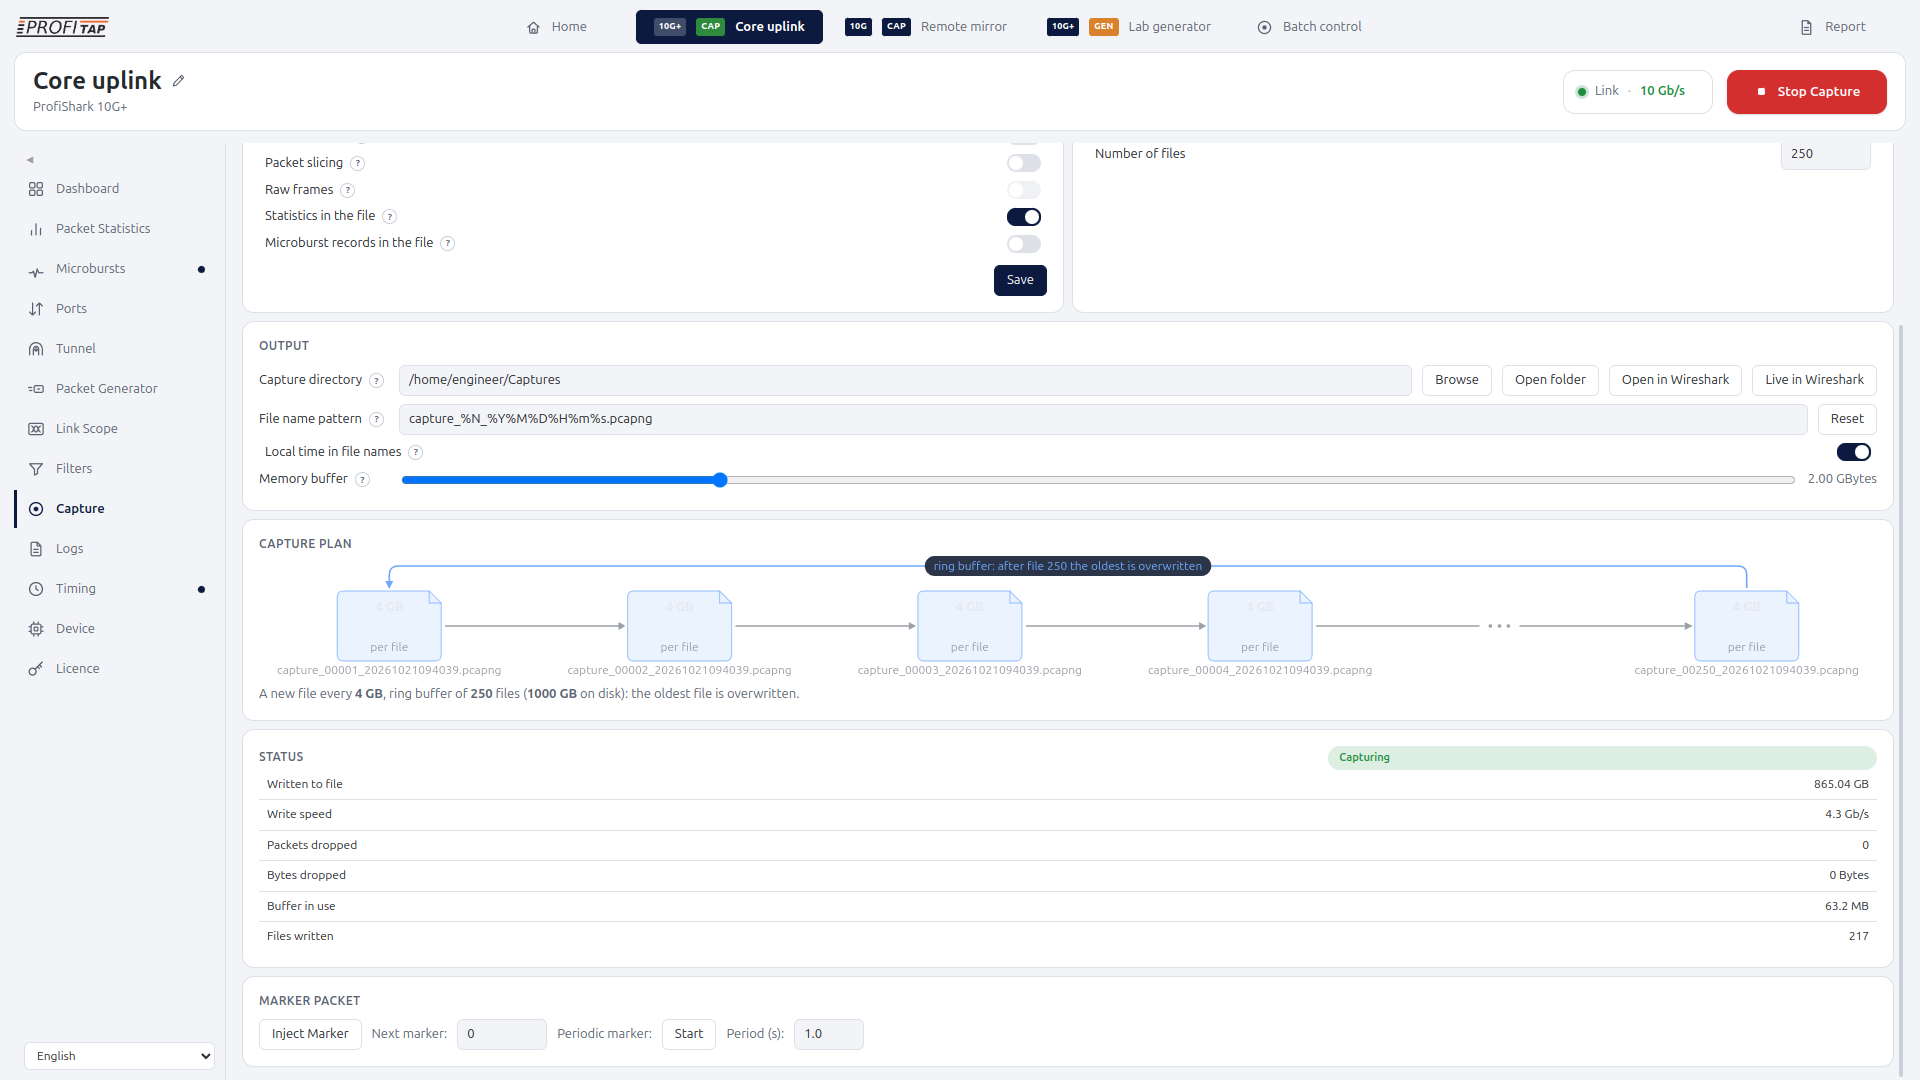
Build and visualize the capture plan before starting, including file size, duration, rotation, and retention behavior.
Traffic Generation
Select what to replay, how frames should vary, how much load to generate, and how the traffic should behave over time.
Physical Diagnostics
Inspect cabling, ports, signal quality, Link Scope measurements, and supported transceiver characteristics.
Tunnel Endpoint
Configure remote mirrored traffic and see which supported tunnel types and sessions are arriving.
Reporting
Create a PDF or web report from an individual diagnostic page or from the complete investigation. Measurements, tables, and charts are rebuilt into a consistent report rather than captured as screenshots.
Troubleshoot faster. Carry less. Escalate with evidence.
For engineering teams and organizations, ProfiShark reduces the distance between “something is wrong” and “this is why.”
Shorter MTTR
Get closer to the root cause before incidents consume hours or days of specialist time.
Correlate physical-link measurements, traffic statistics, microbursts, packet evidence, and historical data in the same diagnostic workflow.
Fewer unnecessary interventions
Features like cable diagnostics, signal quality testing, and traffic analysis allow for thorough link verification before replacing equipment or escalating to another team.
Better use of engineering resources
Give field engineers a repeatable workflow for capture, diagnostics, reporting, and automation across 100M, 1G, 10G, and Single Pair Ethernet.
Evidence-based escalation
Give vendors and infrastructure teams packet-level and physical evidence. Self-describing captures and diagnostic reports preserve the context needed by the next person in the troubleshooting chain.
Lower tooling complexity
Bring capture, supported physical diagnostics, reporting, and automation together with signal analysis, microburst detection, traffic generation/replay, and tunnel termination in one platform.
The one-stop-tool for field network diagnostics across industries
-
Industrial & manufacturing
Investigate production Ethernet with in-line packet evidence, cable diagnostics, and link measurements across conventional Ethernet and 10BASE-T1L SPE.
-
Transportation & rail
Capture and timestamp communications in distributed, time-sensitive systems. Models supporting synchronized timestamping help correlate events between measurement points.
-
Automotive & SPE development
Diagnose 10BASE-T1L systems from connectivity and signal quality through packet behavior. Use in-line capture, cable diagnostics, master/slave information, and selectable transmit level, with traffic generation for validation.
-
Critical infrastructure & utilities
Investigate faults while maintaining controlled, predictable network access. Support investigations with portable diagnostics, self-contained capture evidence, and repeatable procedures.
-
Enterprise & data center
Investigate application/network interactions with packet capture and traffic statistics. Add microburst analysis for transient congestion or hardware tunnel termination for remotely mirrored traffic.
-
R&D and validation labs
Capture a condition, reproduce it, and verify device behavior. Traffic generation/replay and Link Scope add controlled load patterns, raw-frame testing, address variation, and signal analysis to scriptable workflows.
Comparison table
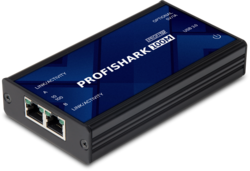
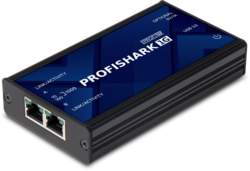
| Capability | 100M | 1G | 1G+ | 10G | 10G+ | SPE |
|---|---|---|---|---|---|---|
 Discover |
 Discover |
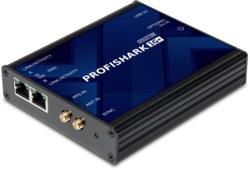 Discover |
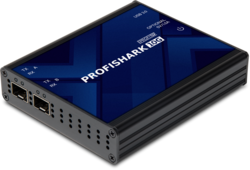 Discover |
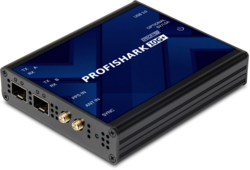 Discover |
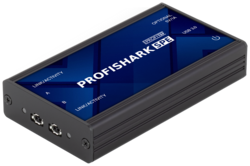 Discover |
|
| Best for | Fast Ethernet, legacy and industrial | Everyday 1G troubleshooting | 1G with synchronized timestamps | 1/10G diagnostics and test | 1/10G with synchronized timestamps | Single Pair Ethernet: automotive, industrial, OT |
| Network | 10/100 RJ45 | 10/100/1000 RJ45 | 10/100/1000 RJ45 | 1/10G SFP/SFP+ | 1/10G SFP/SFP+ | 10BASE-T1L |
| Deployment | ||||||
| In-line operation | ✓ | ✓ | ✓ | ✓ | ✓ | ✓ |
| SPAN mode | — | ✓ | ✓ | ✓ | ✓ | ✓ |
| Wireshark, CLI and reports on Windows, Linux and macOS | ✓ | ✓ | ✓ | ✓ | ✓ | ✓ |
| Physical layer | ||||||
| Cable and pair diagnostics | — | ✓1 | ✓1 | — | — | Link diagnostics |
| SFP diagnostics | — | — | — | ✓ | ✓ | — |
| Link Scope eye diagram, jitter and BER | — | — | — | License | License | — |
| Link layer | ||||||
| Auto-negotiation diagnostics (speed, duplex, EEE) | ✓ | ✓ incl. EEE | ✓ incl. EEE | 1/10G auto-speed | 1/10G auto-speed | ✓ |
| Packet layer | ||||||
| Packet capture | ✓ | ✓ | ✓ | ✓2 | ✓2 | ✓ |
| Per-port drop and CRC counters | ✓ | ✓ | ✓ | ✓ | ✓ | ✓ |
| Hardware capture filters and slicing | — | — | — | ✓ | ✓ | — |
| Microburst detection | — | — | — | License | License | — |
| Tunnel endpoint / hardware decapsulation | — | — | — | License | License | — |
| Timing | ||||||
| Hardware timestamps | ✓ | ✓ | ✓ | ✓ | ✓ | ✓ |
| GPS / Galileo / GLONASS / PPS synchronization | — | — | ✓ | — | ✓ | — |
| Traffic generation | ||||||
| Packet generation | — | ✓1 | ✓1 | — | — | ✓ |
| Line-rate traffic generation and capture replay | — | — | — | License | License | — |
- Available on supported/current hardware revisions.
- All processes and features operate at full line rate. Data transfer to PC is limited at USB 3.0 speeds.
Thank you!
Your submission has been sent. If you want more information, solutions, and use cases, check out the links below:Did You Know?

ProfiShark FAQ
How much history does ProfiShark Manager keep?
ProfiShark Manager keeps up to 24 hours of history, combining detailed recent measurements with longer-term data on one timeline. Related charts align to the same point in time, making it easier to compare traffic, microbursts, errors, and other events.
How does ProfiShark Manager alert me to network issues?
Active functions and new diagnostic events are marked directly in the navigation. Packet drops, damaged frames, microbursts, and failed self-tests remain visible until they have been reviewed.
Can I identify individual ProfiShark devices?
Yes. Each ProfiShark can be given a persistent alias, such as “Rack 3 – Uplink”, making multiple units easier to identify in ProfiShark Manager, reports, and capture files.
Does ProfiShark Manager include built-in help?
Yes. Controls and measurements include contextual help explaining what they do and what their values mean, so engineers can understand diagnostic results without constantly referring to a separate manual.
Can ProfiShark Manager create diagnostic reports?
Yes. Individual pages or a complete investigation can be exported as a PDF or web report, combining measurements, tables, and charts into a consistent document for sharing or escalation.
Where can I download ProfiShark software, drivers, and firmware?
ProfiShark Manager for Windows and macOS is available from the ProfiShark software repository.
On Linux, ProfiShark Manager and its drivers are installed from the Profitap APT repository. The Linux setup instructions list the supported distributions and the steps to add the repository.
Step-by-step installation for every platform is covered in the ProfiShark Manager User Guide.
How are ProfiShark firmware updates managed?
The ProfiShark range shares a common firmware platform across supported hardware generations. ProfiShark Manager checks what a connected device requires and provides the appropriate firmware update.
Supported devices can also be recovered through the Manager if their boot firmware is damaged or missing.
Can I switch a ProfiShark 10G between capture and traffic generation?
Yes. On ProfiShark 10G and 10G+, switching between capture and traffic-generation firmware is handled directly from the device page in ProfiShark Manager.
Does ProfiShark work with Wireshark?
Yes. ProfiShark Manager can install or update the ProfiShark-Wireshark capture integration and dissector.
Supported metadata, statistics, timing information, and diagnostics can accompany both captures written to disk and supported live Wireshark captures.
Can ProfiShark captures include diagnostic context?
Yes. Captures can include information such as device identity, link speed, clock state, applied filters, per-port statistics, and supported diagnostic data within custom blocks.
This makes captures easier to analyze later or share with another engineer without losing important measurement context.
Can ProfiShark Manager be automated?
Yes. The ProfiShark command-line tool ships with the Manager and uses the same underlying platform.
Capture, filtering, traffic generation, timing, and diagnostic workflows can therefore move from the graphical interface into repeatable scripts.
Which operating systems does ProfiShark Manager support?
ProfiShark Manager is available for Windows, Linux, and macOS, providing a consistent diagnostic workflow across all three platforms.
Which languages does ProfiShark Manager support?
The interface supports English, French, German, and Spanish, as well as light and dark themes and system-aware formatting for dates and numbers.
Can ProfiShark receive mirrored traffic?
ProfiShark 10G and 10G+ can act as hardware tunnel endpoints for supported mirrored traffic, including VXLAN and ERSPAN.
The tunnel is terminated in hardware, so the inner traffic can be filtered, captured, and analyzed without requiring the host computer to perform the decapsulation.
Can I automate repeatable traffic tests?
Yes. Generator configurations can be saved and loaded, and supported traffic-generation functions can be controlled from the command line. This allows an interactively created test to become part of a repeatable validation workflow.
Does ProfiShark support multiple models through the same workflow?
Yes. ProfiShark Manager provides a common environment across the ProfiShark family, so engineers can use the same general capture, diagnostics, reporting, and automation workflow across supported 100M, 1G, 10G, and SPE devices.