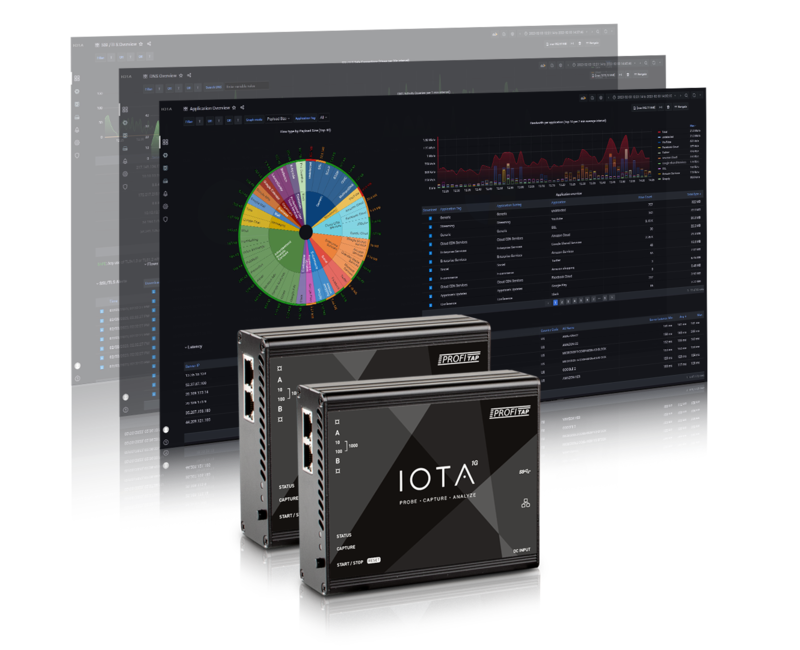
Network traffic capture and analysis for core networks
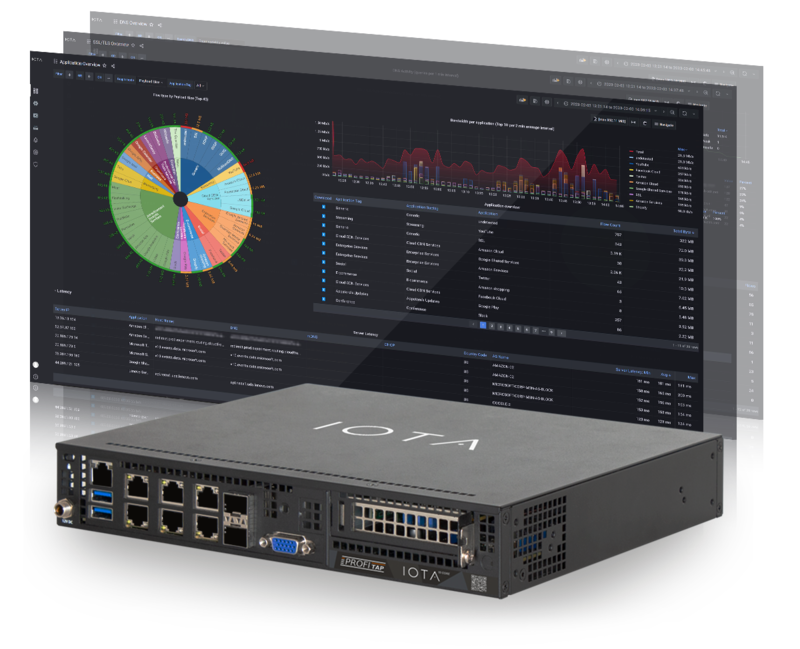
IOTA 10 CORE is a high-speed packet capture and analysis solution for core networks, large branches, and data centers.
Combining high-performance capture capabilities, a metadata extraction engine, and integrated analysis dashboards, IOTA 10 CORE provides visibility into any key point of interest in which it is deployed.
With detailed real-time and historical insights into critical applications and data, IOTA helps quickly resolve network performance and application issues.
KEEP AN EYE ON YOUR NETWORK
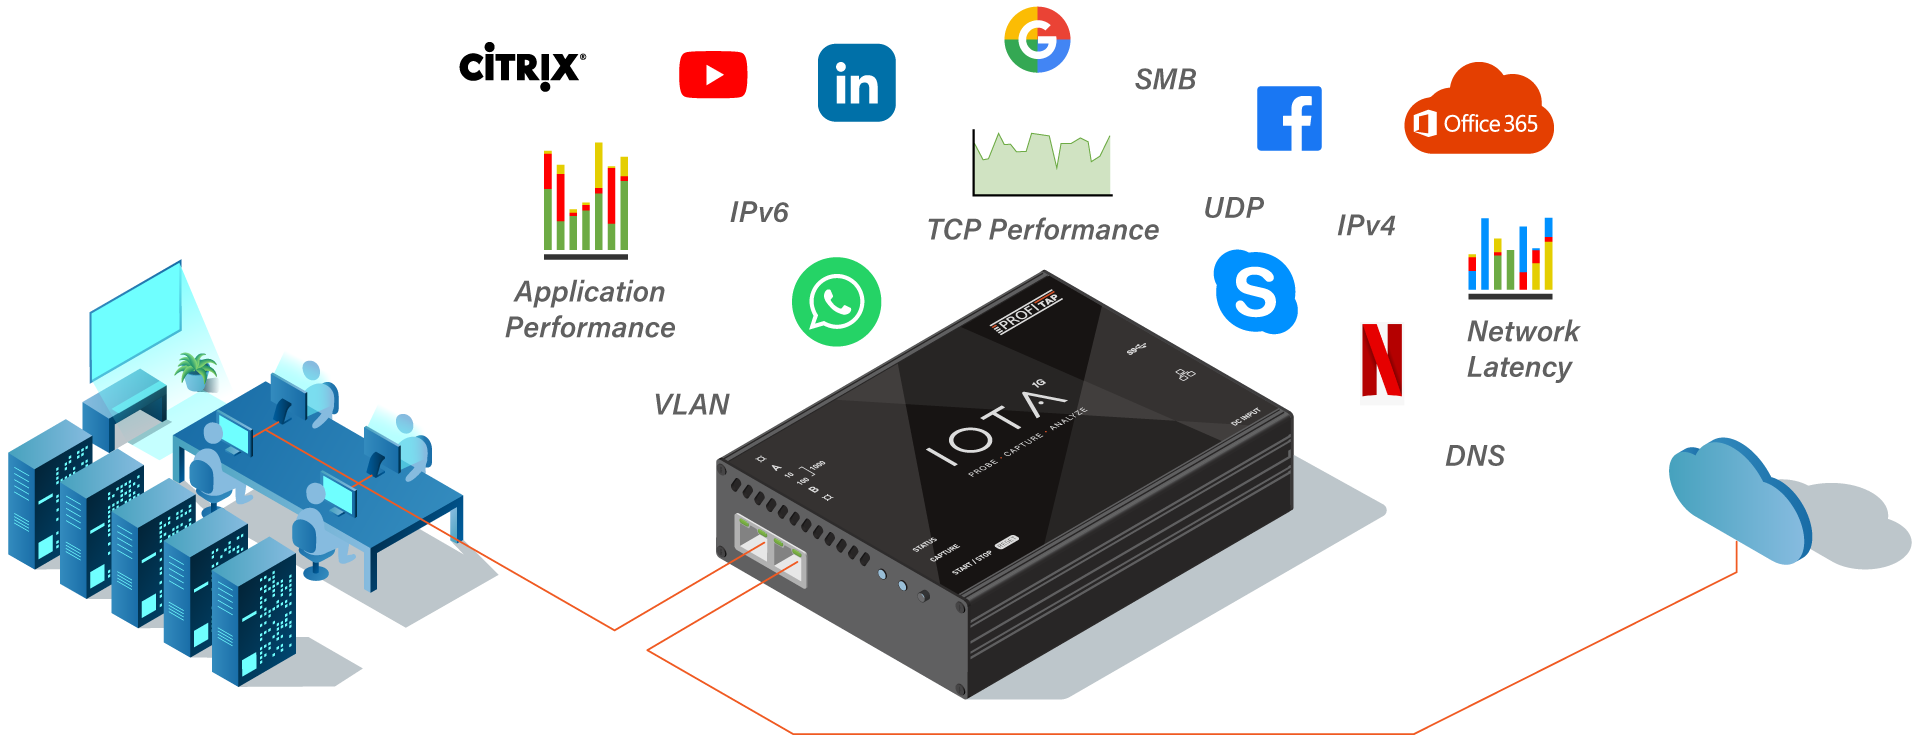
Monitor hosts, top talkers, latency, TCP, UDP, IPv4, IPv6, VLAN, DNS and many more at a glance, using a premade set of comprehensive dashboards.
REMOTE MONITORING
Fully managed over HTTPS and with built-in VPN, it offers easy deployment and usage in any network topology.
HIGHLY EFFICIENT METADATA COLLECTION
Up to 100 KPIs are extracted from packets, TCP/UDP flow and flow behavior. Flow metadata can reduce the volume of data by 90% compared to the original PCAP trace.
MONITOR NETWORK PERFORMANCE
Keep a close eye on the most essential performance metrics, retransmissions, packet loss, latency, throughput, availability, connectivity and more.
TRACK DOWN SECURITY FLAWS AND PROTOCOL/APPLICATION USAGE
Full visibility over 200+ applications and protocols (DNS, HTTP, SSH, Office 365, Skype, Whatsapp, Netflix, etc.)
4, 8, or 16 TB STORAGE
PCAP collection, metadata database and system are stored on a high-performance SSD.
QUICK SEARCH DATABASE
Explore long-term dataset accumulated over days, weeks or months.
FAST DRILL-DOWN WITH IOTA DASHBOARDS
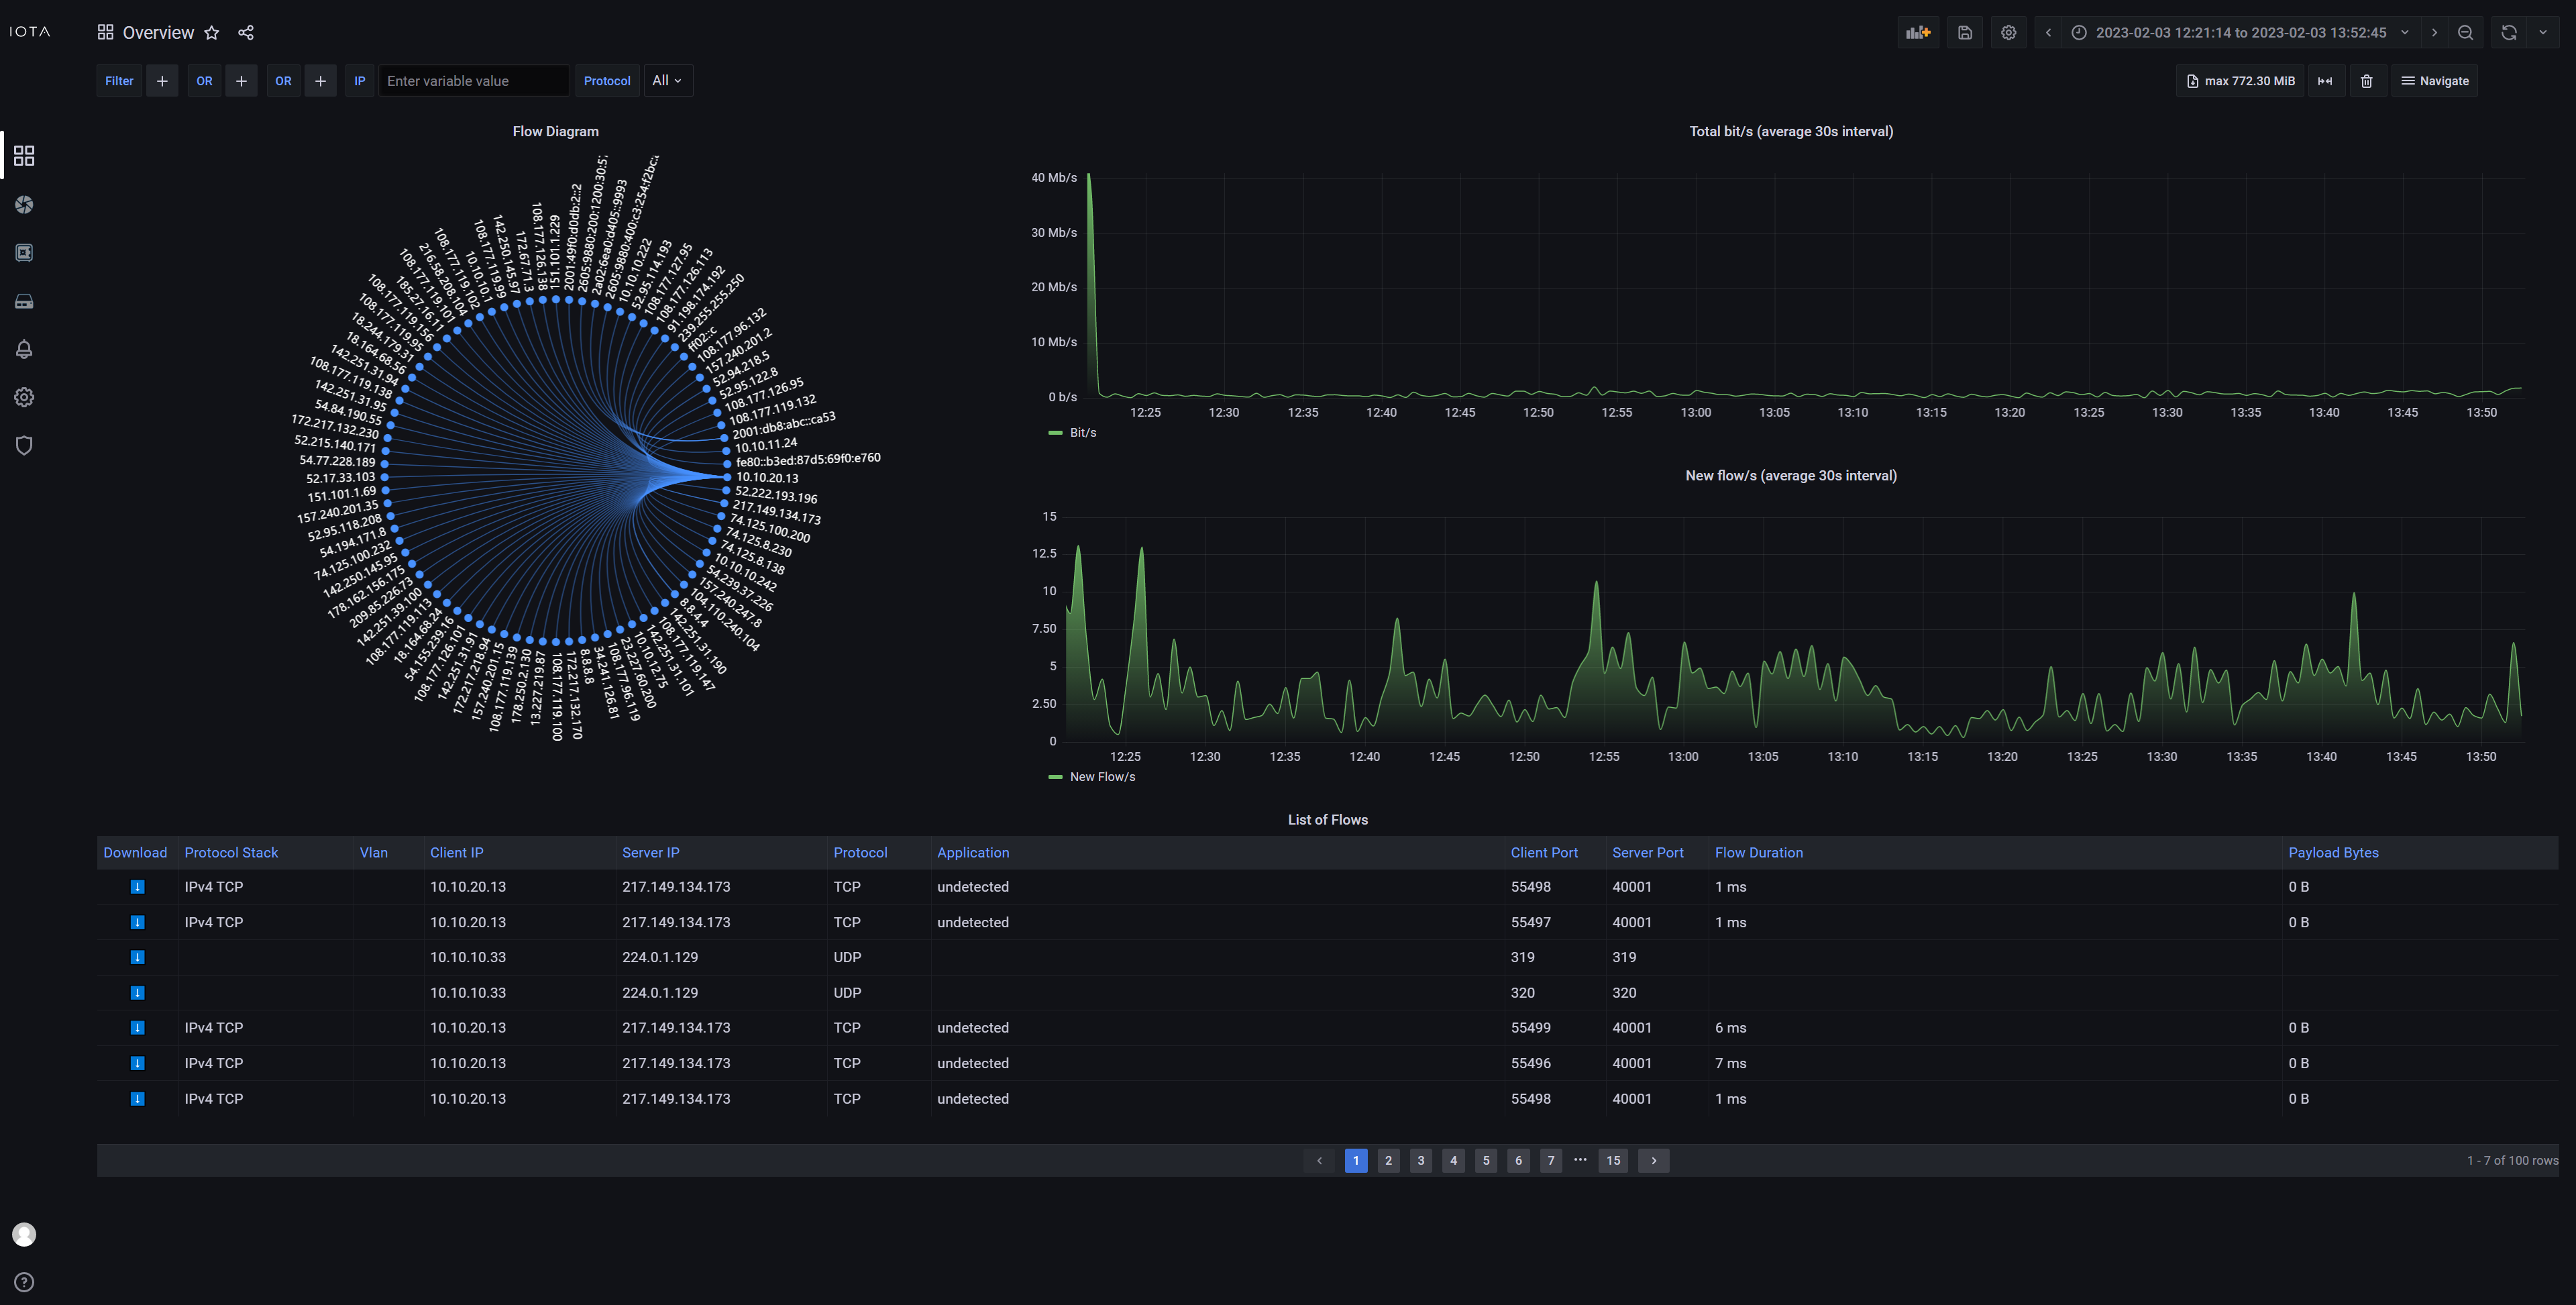
- Overview
- Application Overview
- VoIP
- HTTP
- Local Assets
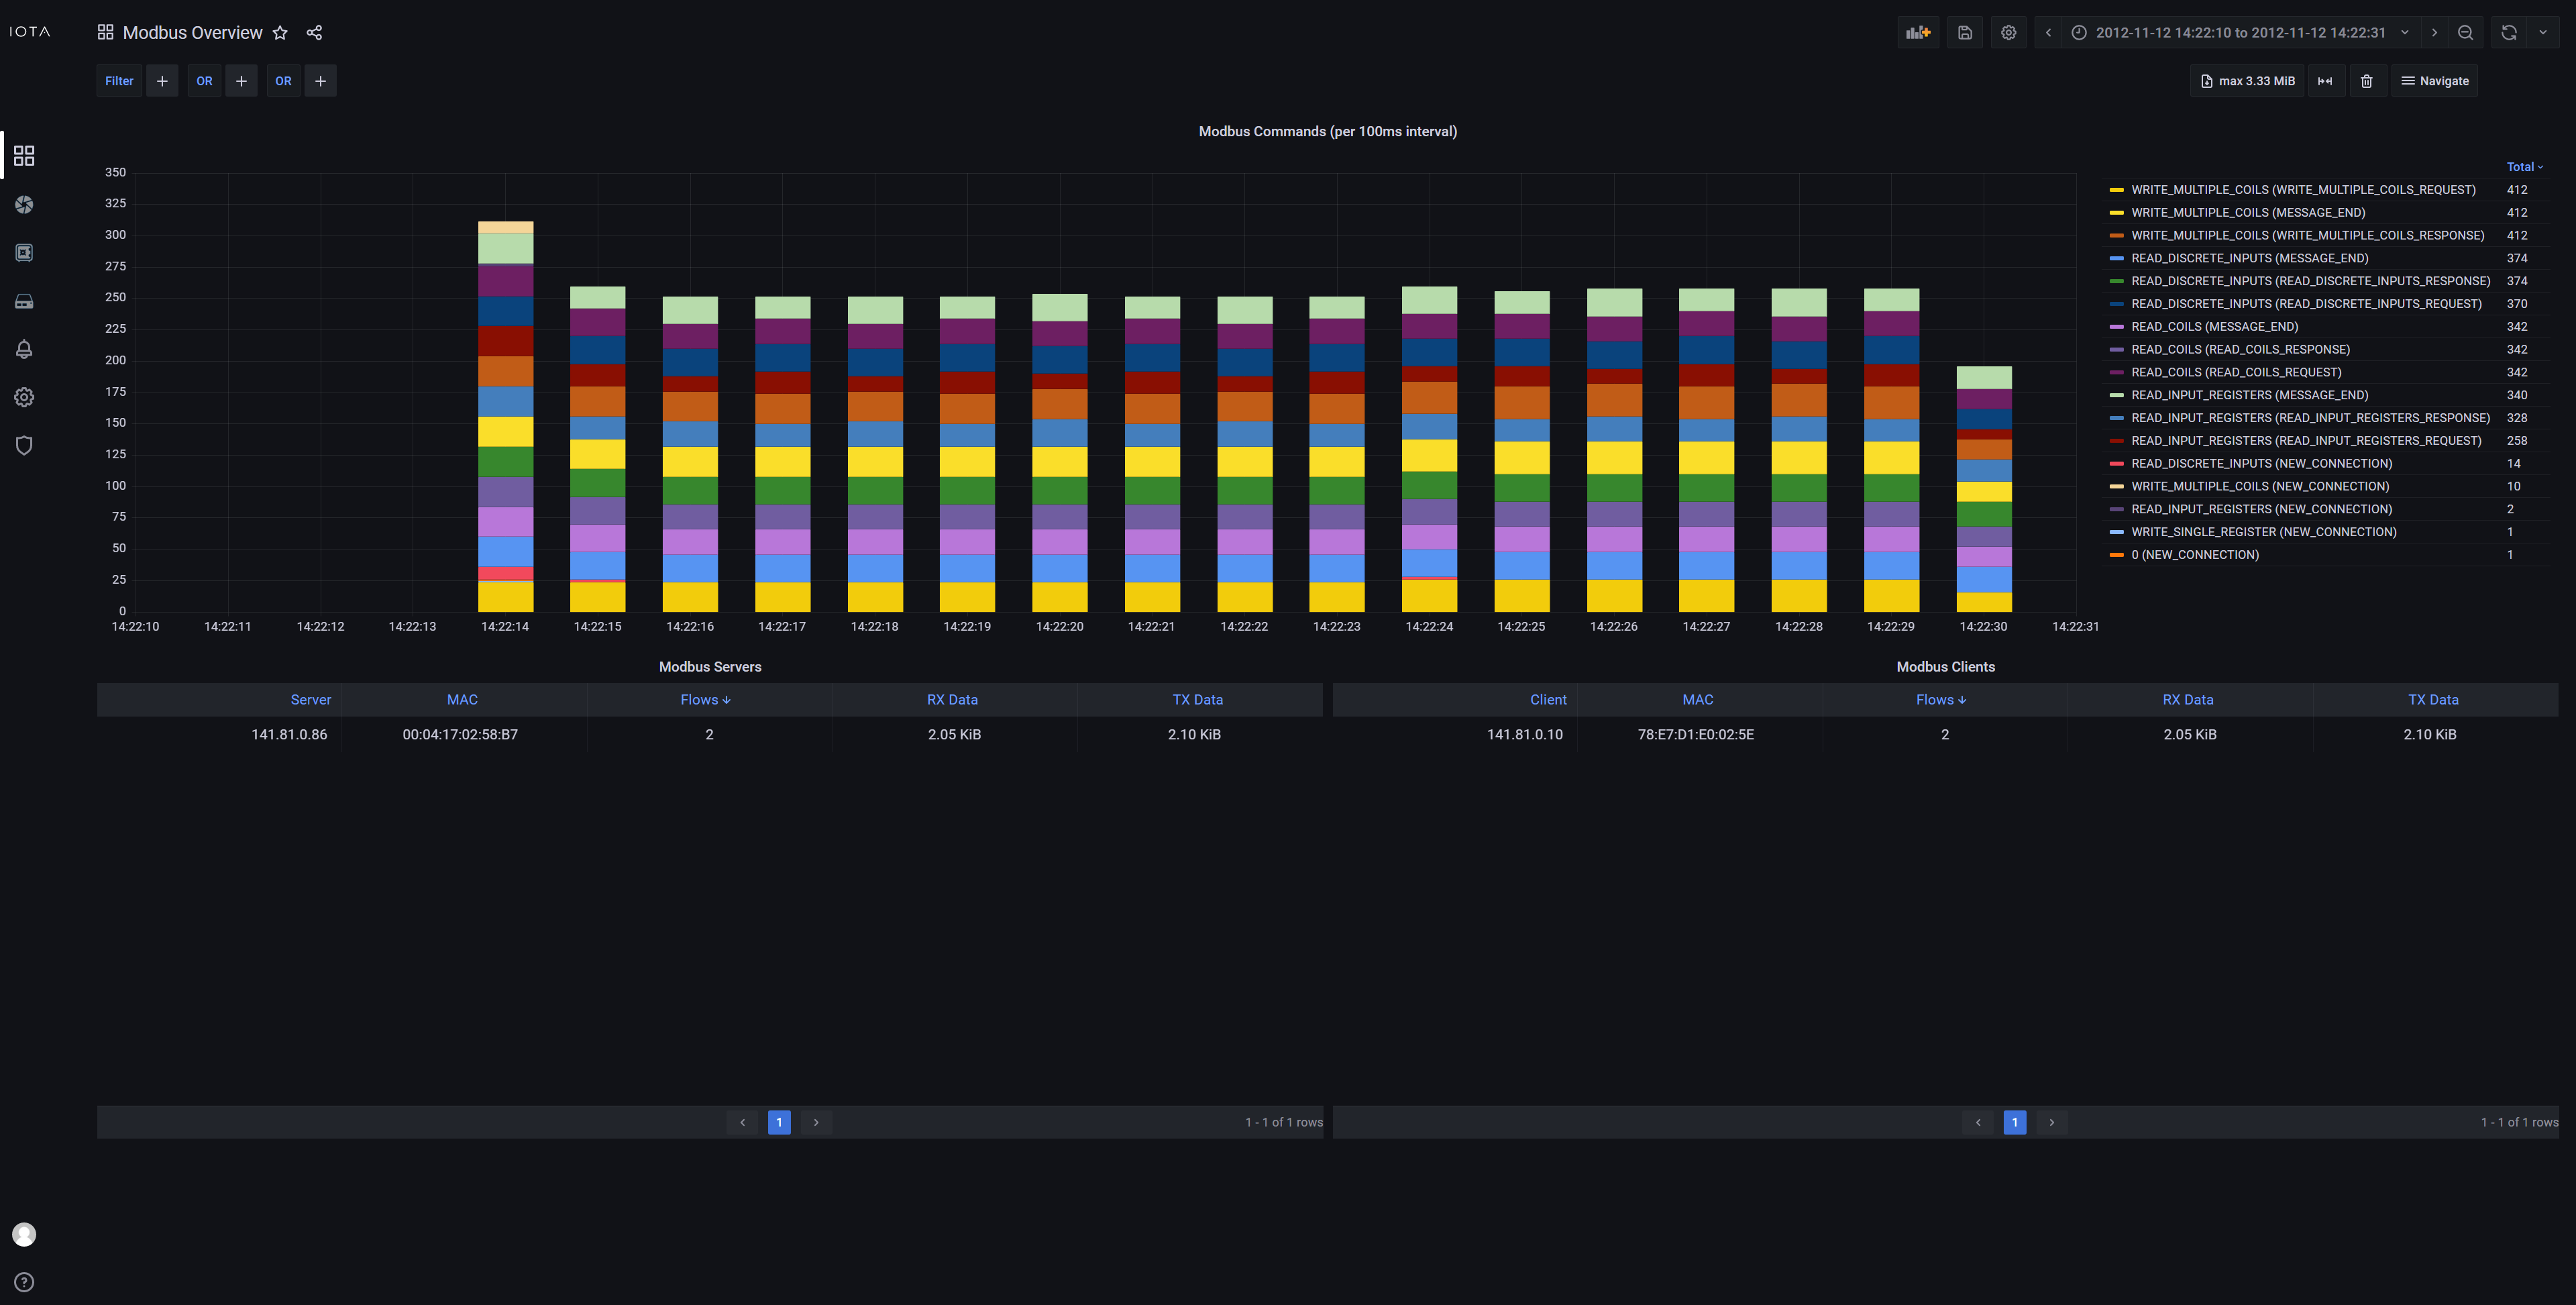
- Modbus
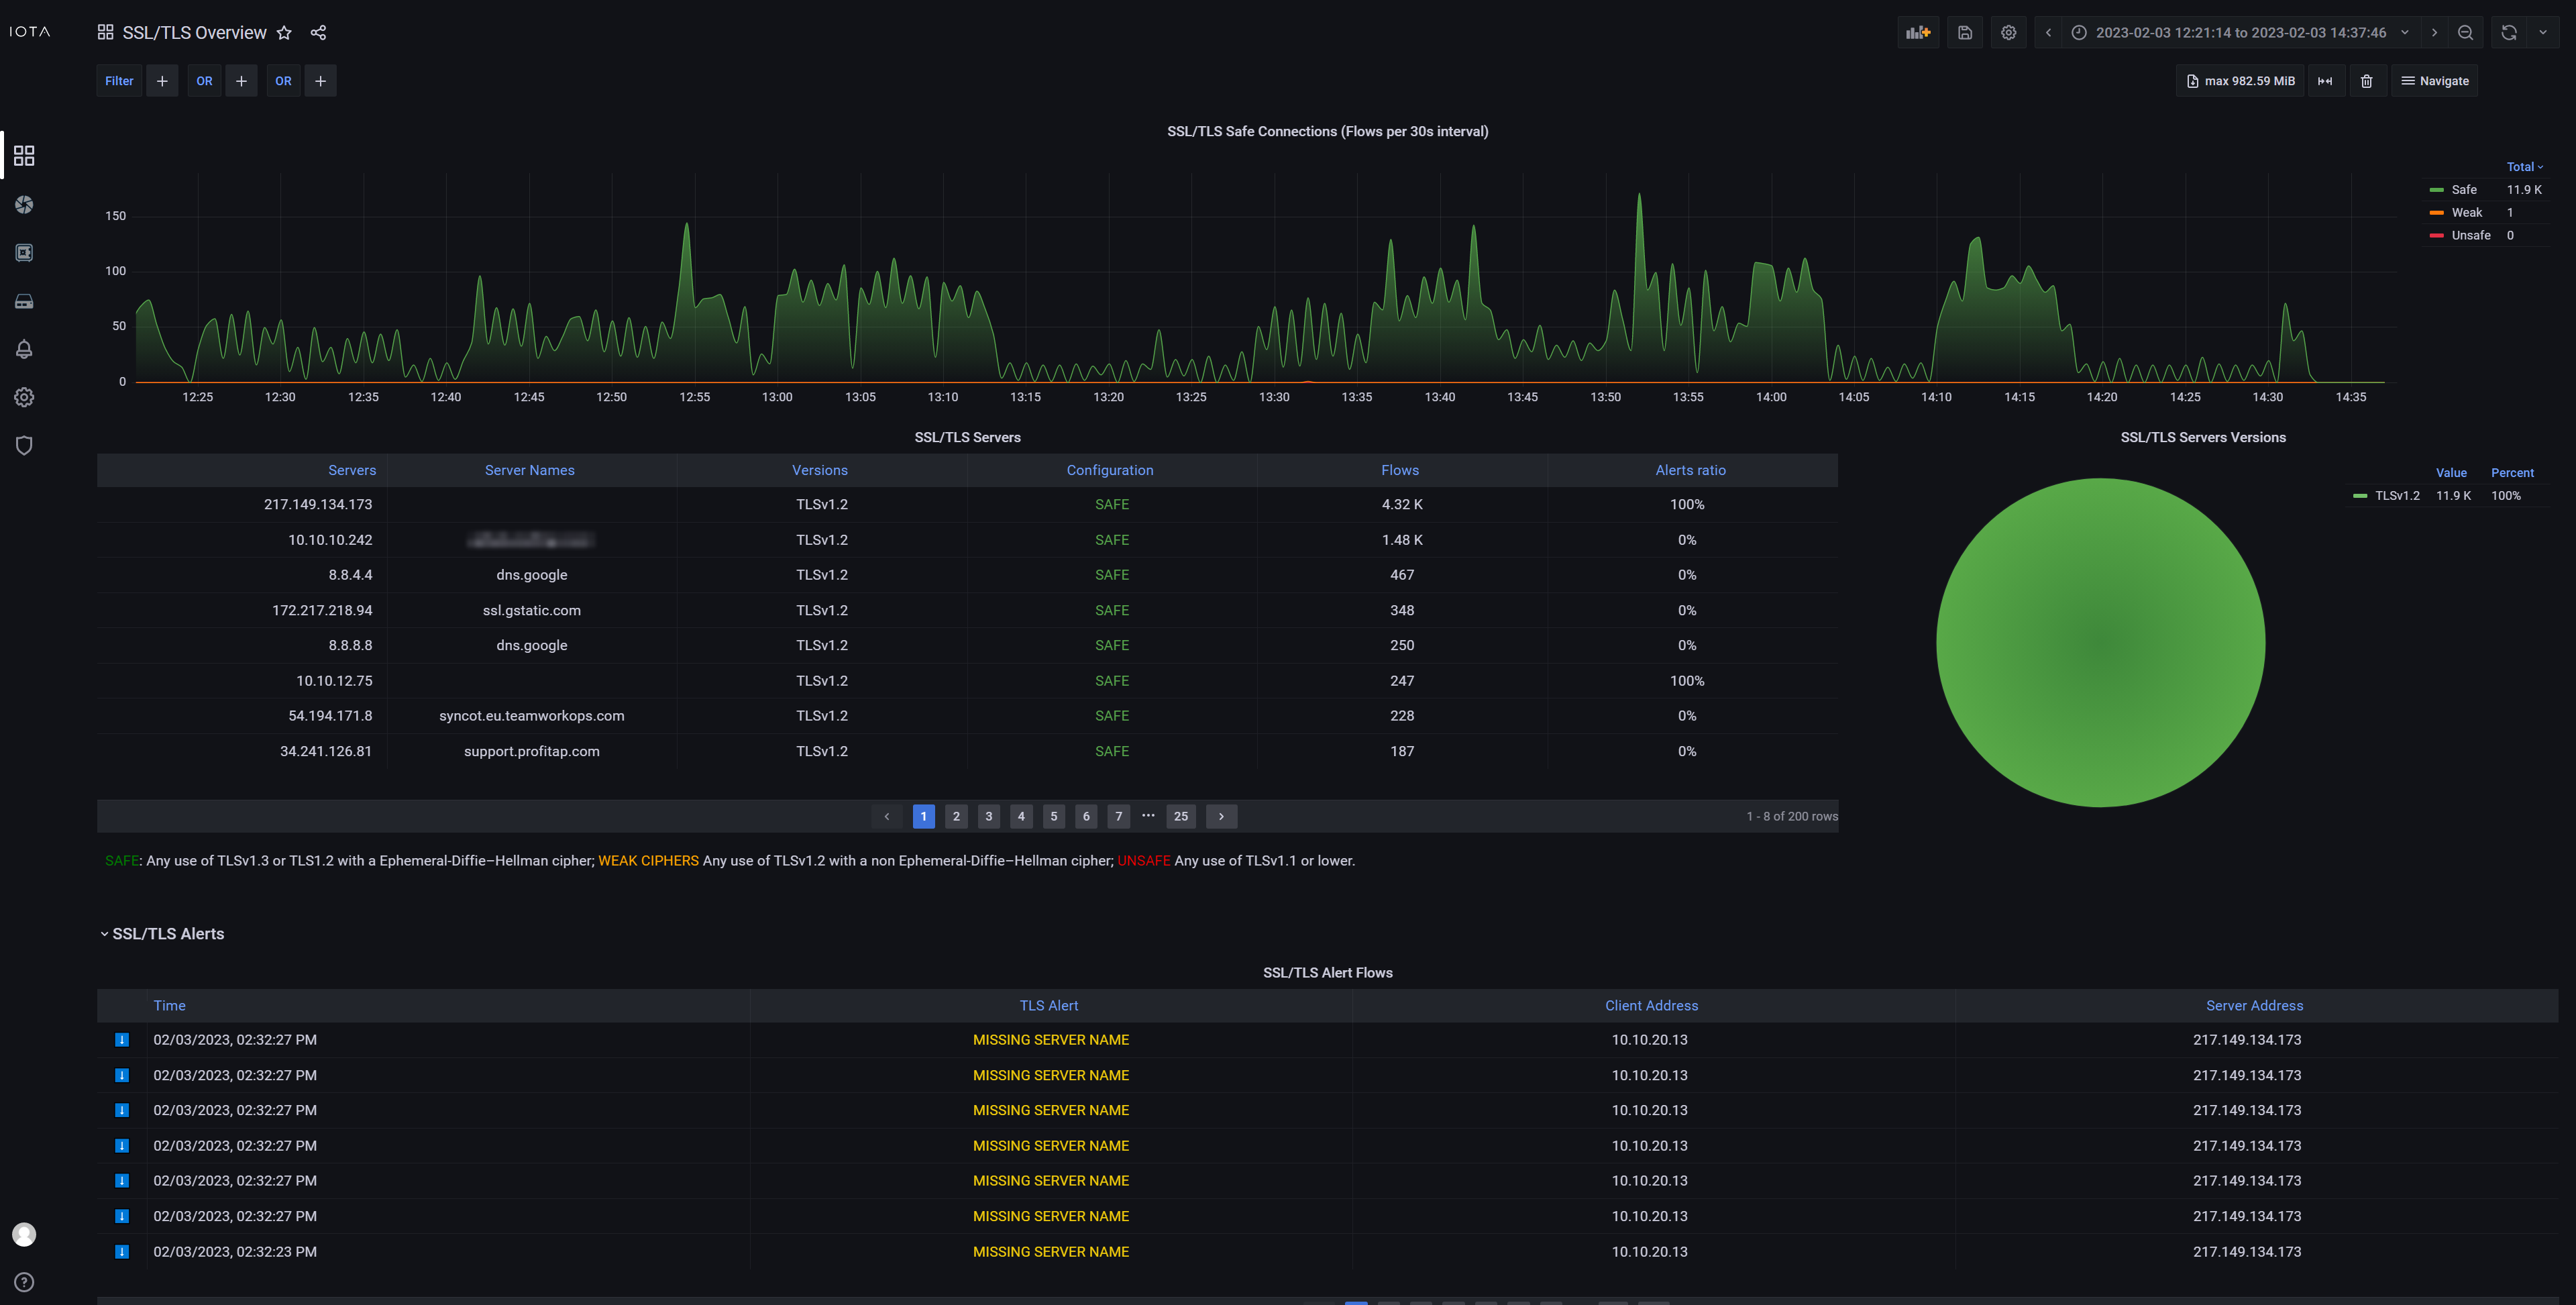
- SSL/TLS
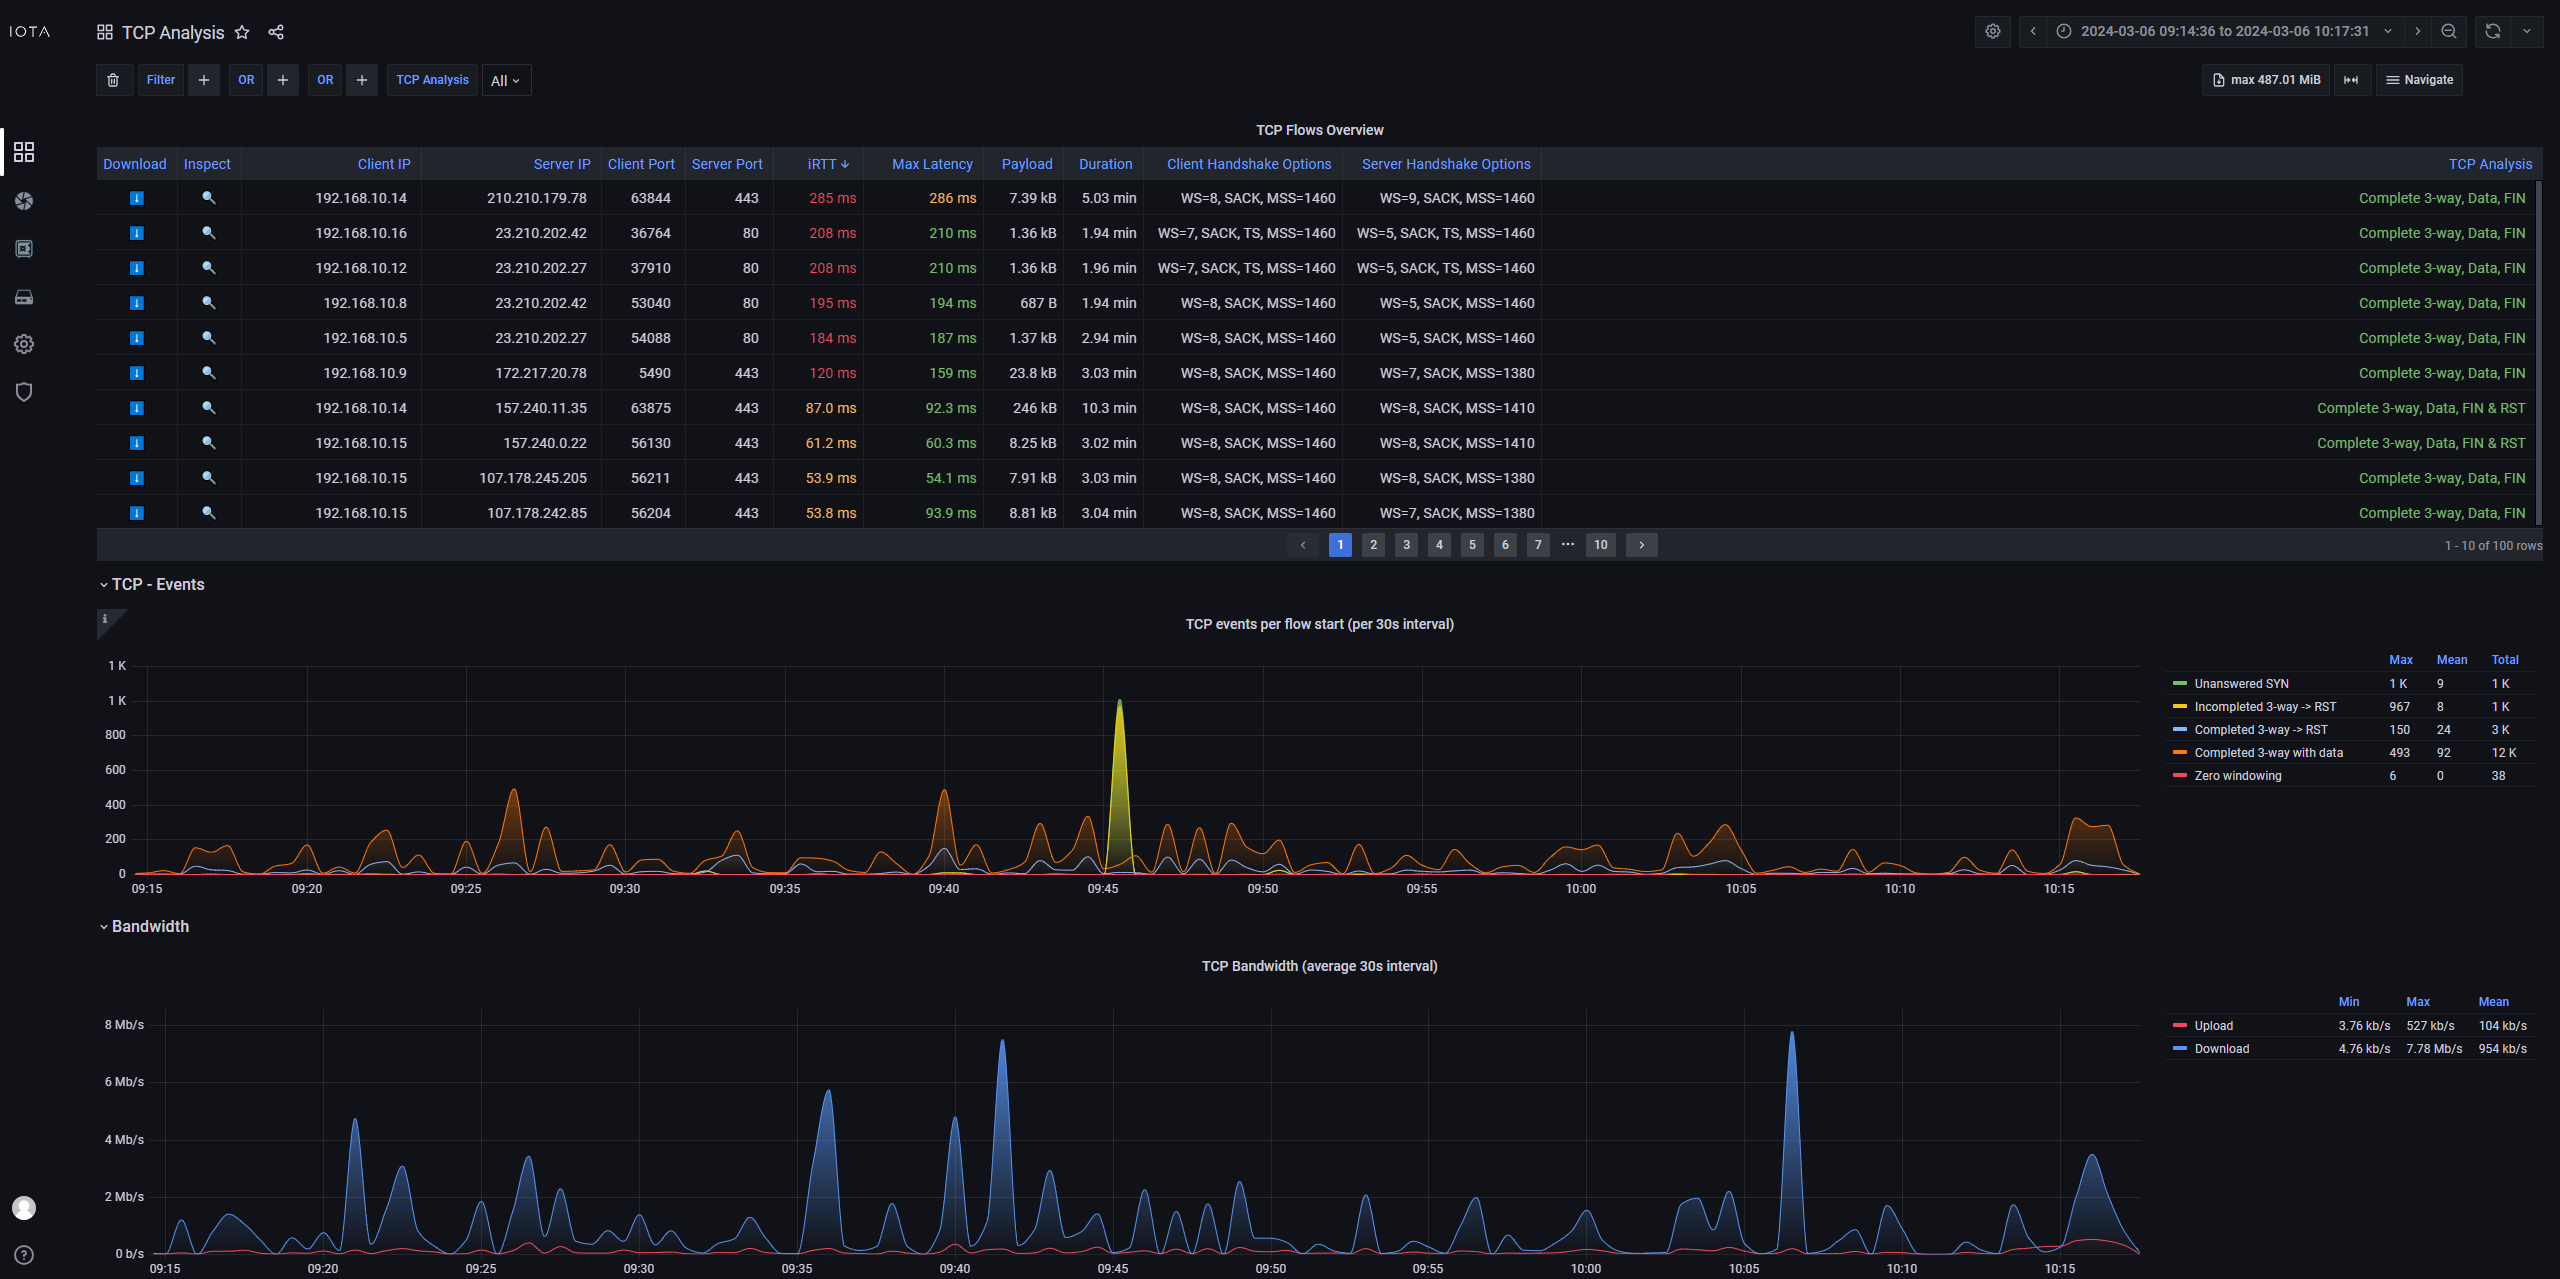
- TCP
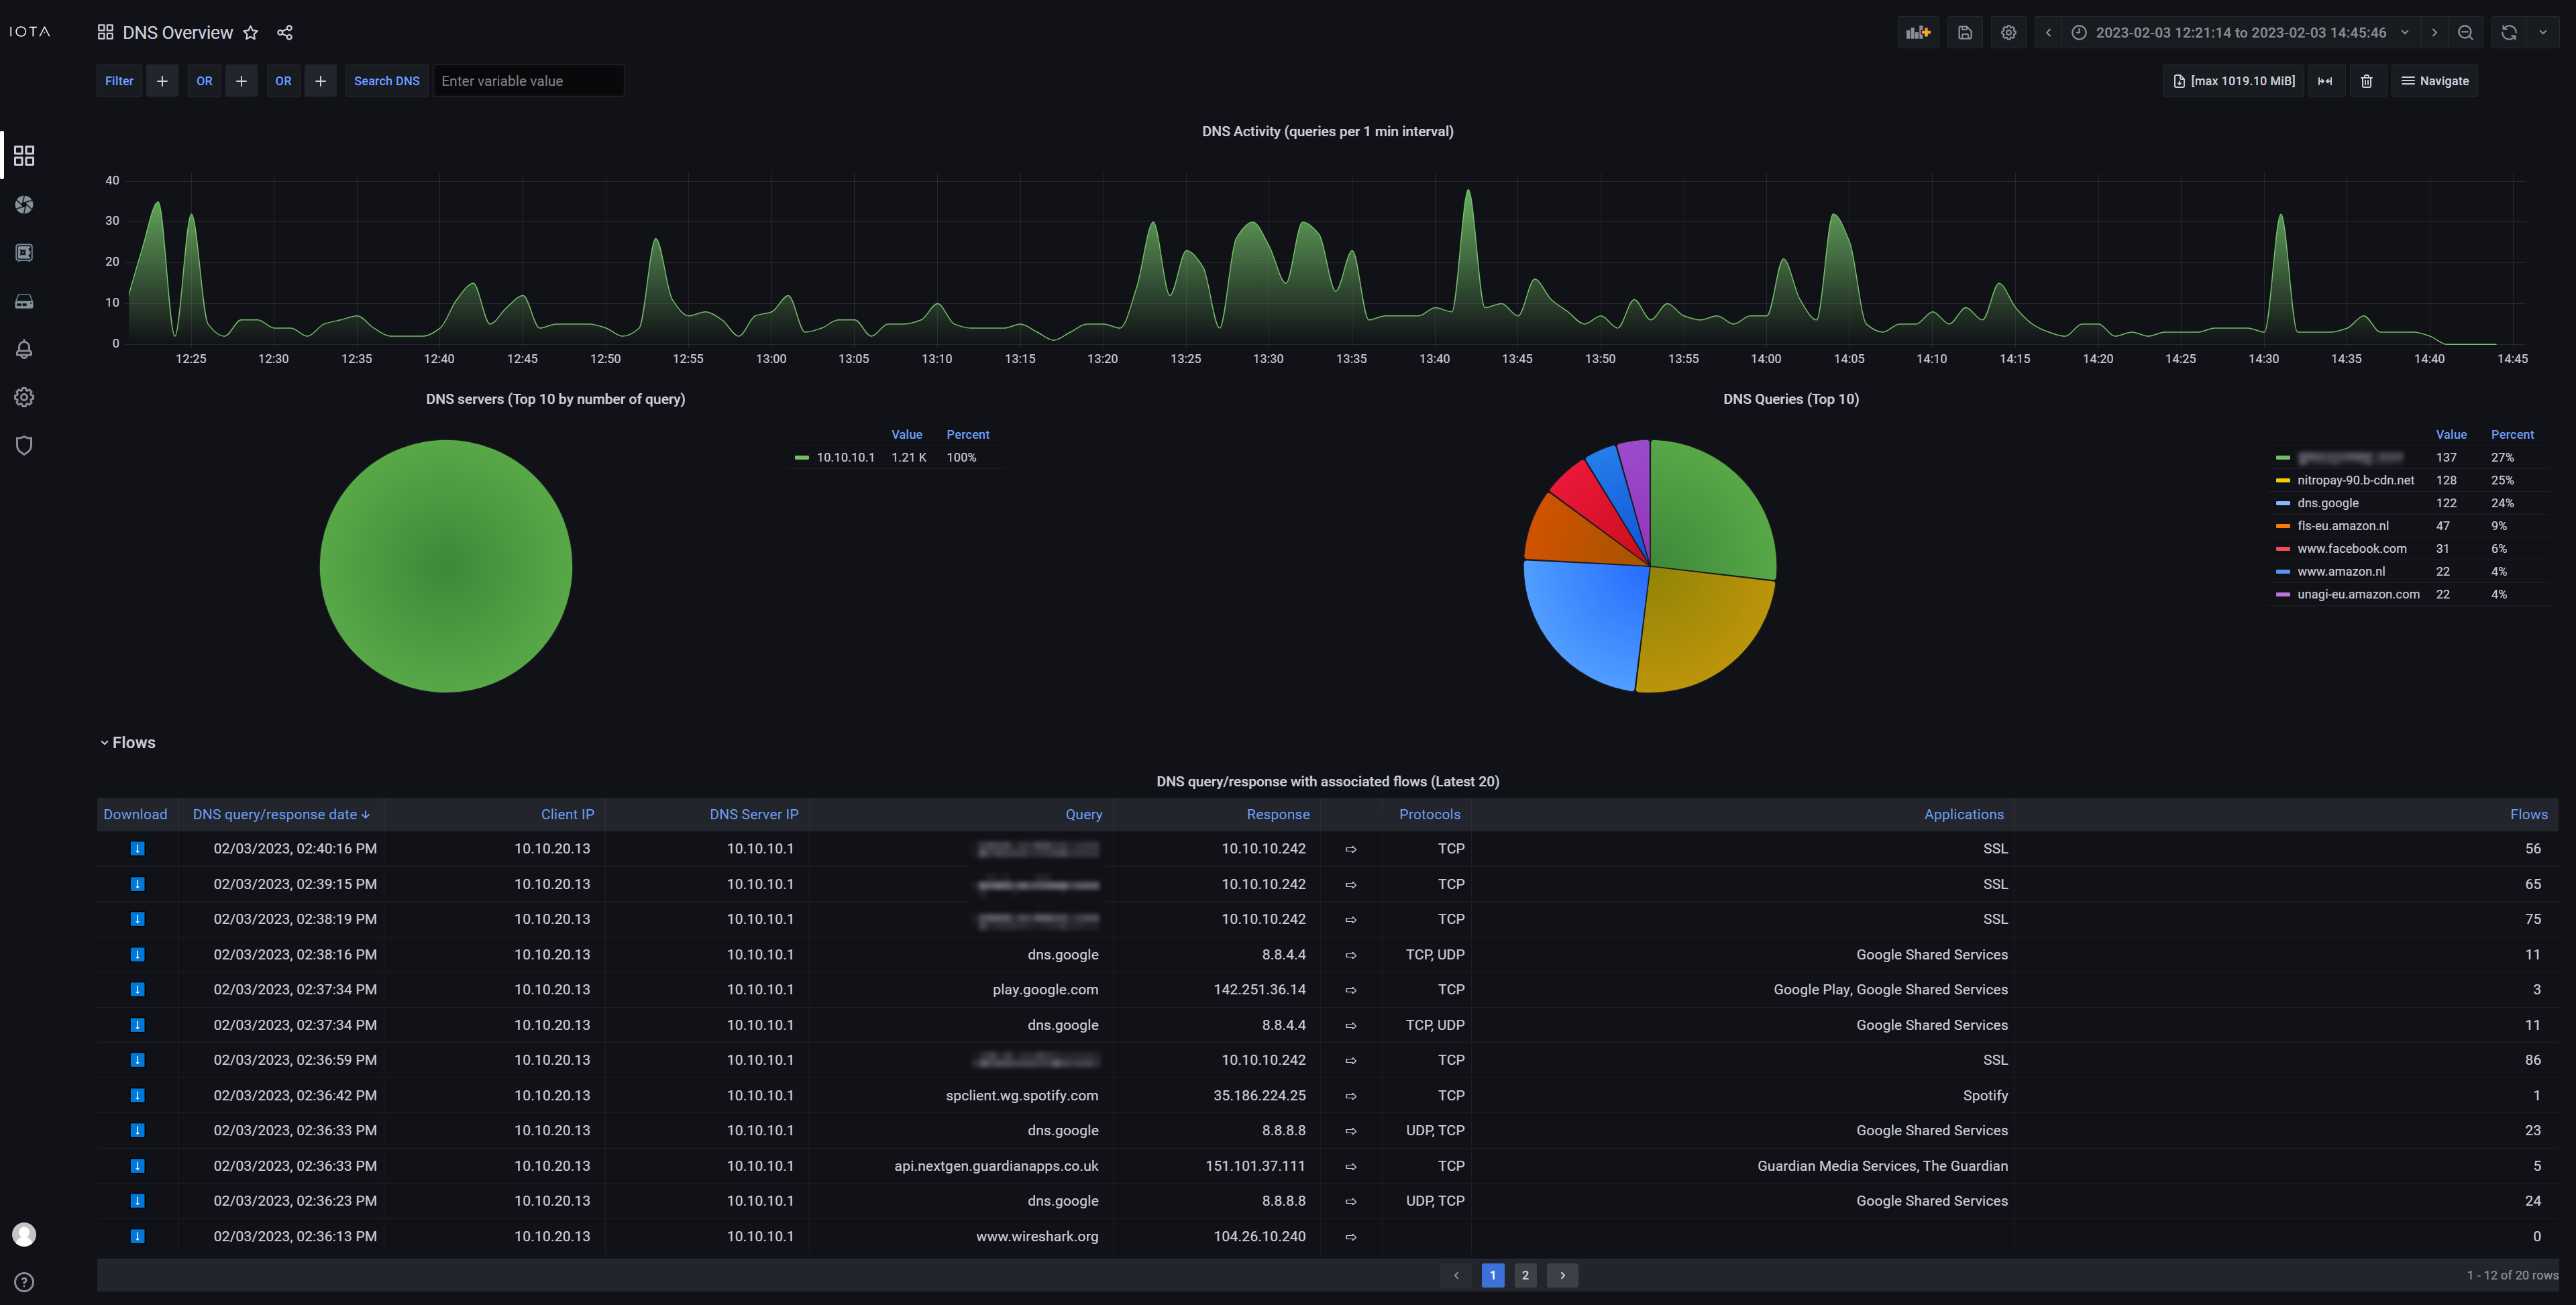
- DNS
- Host Details
- Flow Details
- Analysis Sessions
The Overview dashboard gives you a quick initial overview of what is happening on your network by displaying the interfaces involved, who is talking to whom, and how much. The flow diagram is a visual representation of the relationships between interfaces, which helps you to easily identify the top talkers. Clicking an IP address in this diagram creates a dashboard filter, resulting in the dashboard only displaying data involving this IP address. The network traffic charts displaying bandwidth usage and number of new flows over time are a great way to identify potential time ranges of interest. Clicking and dragging on either chart zooms in on the selected time range.
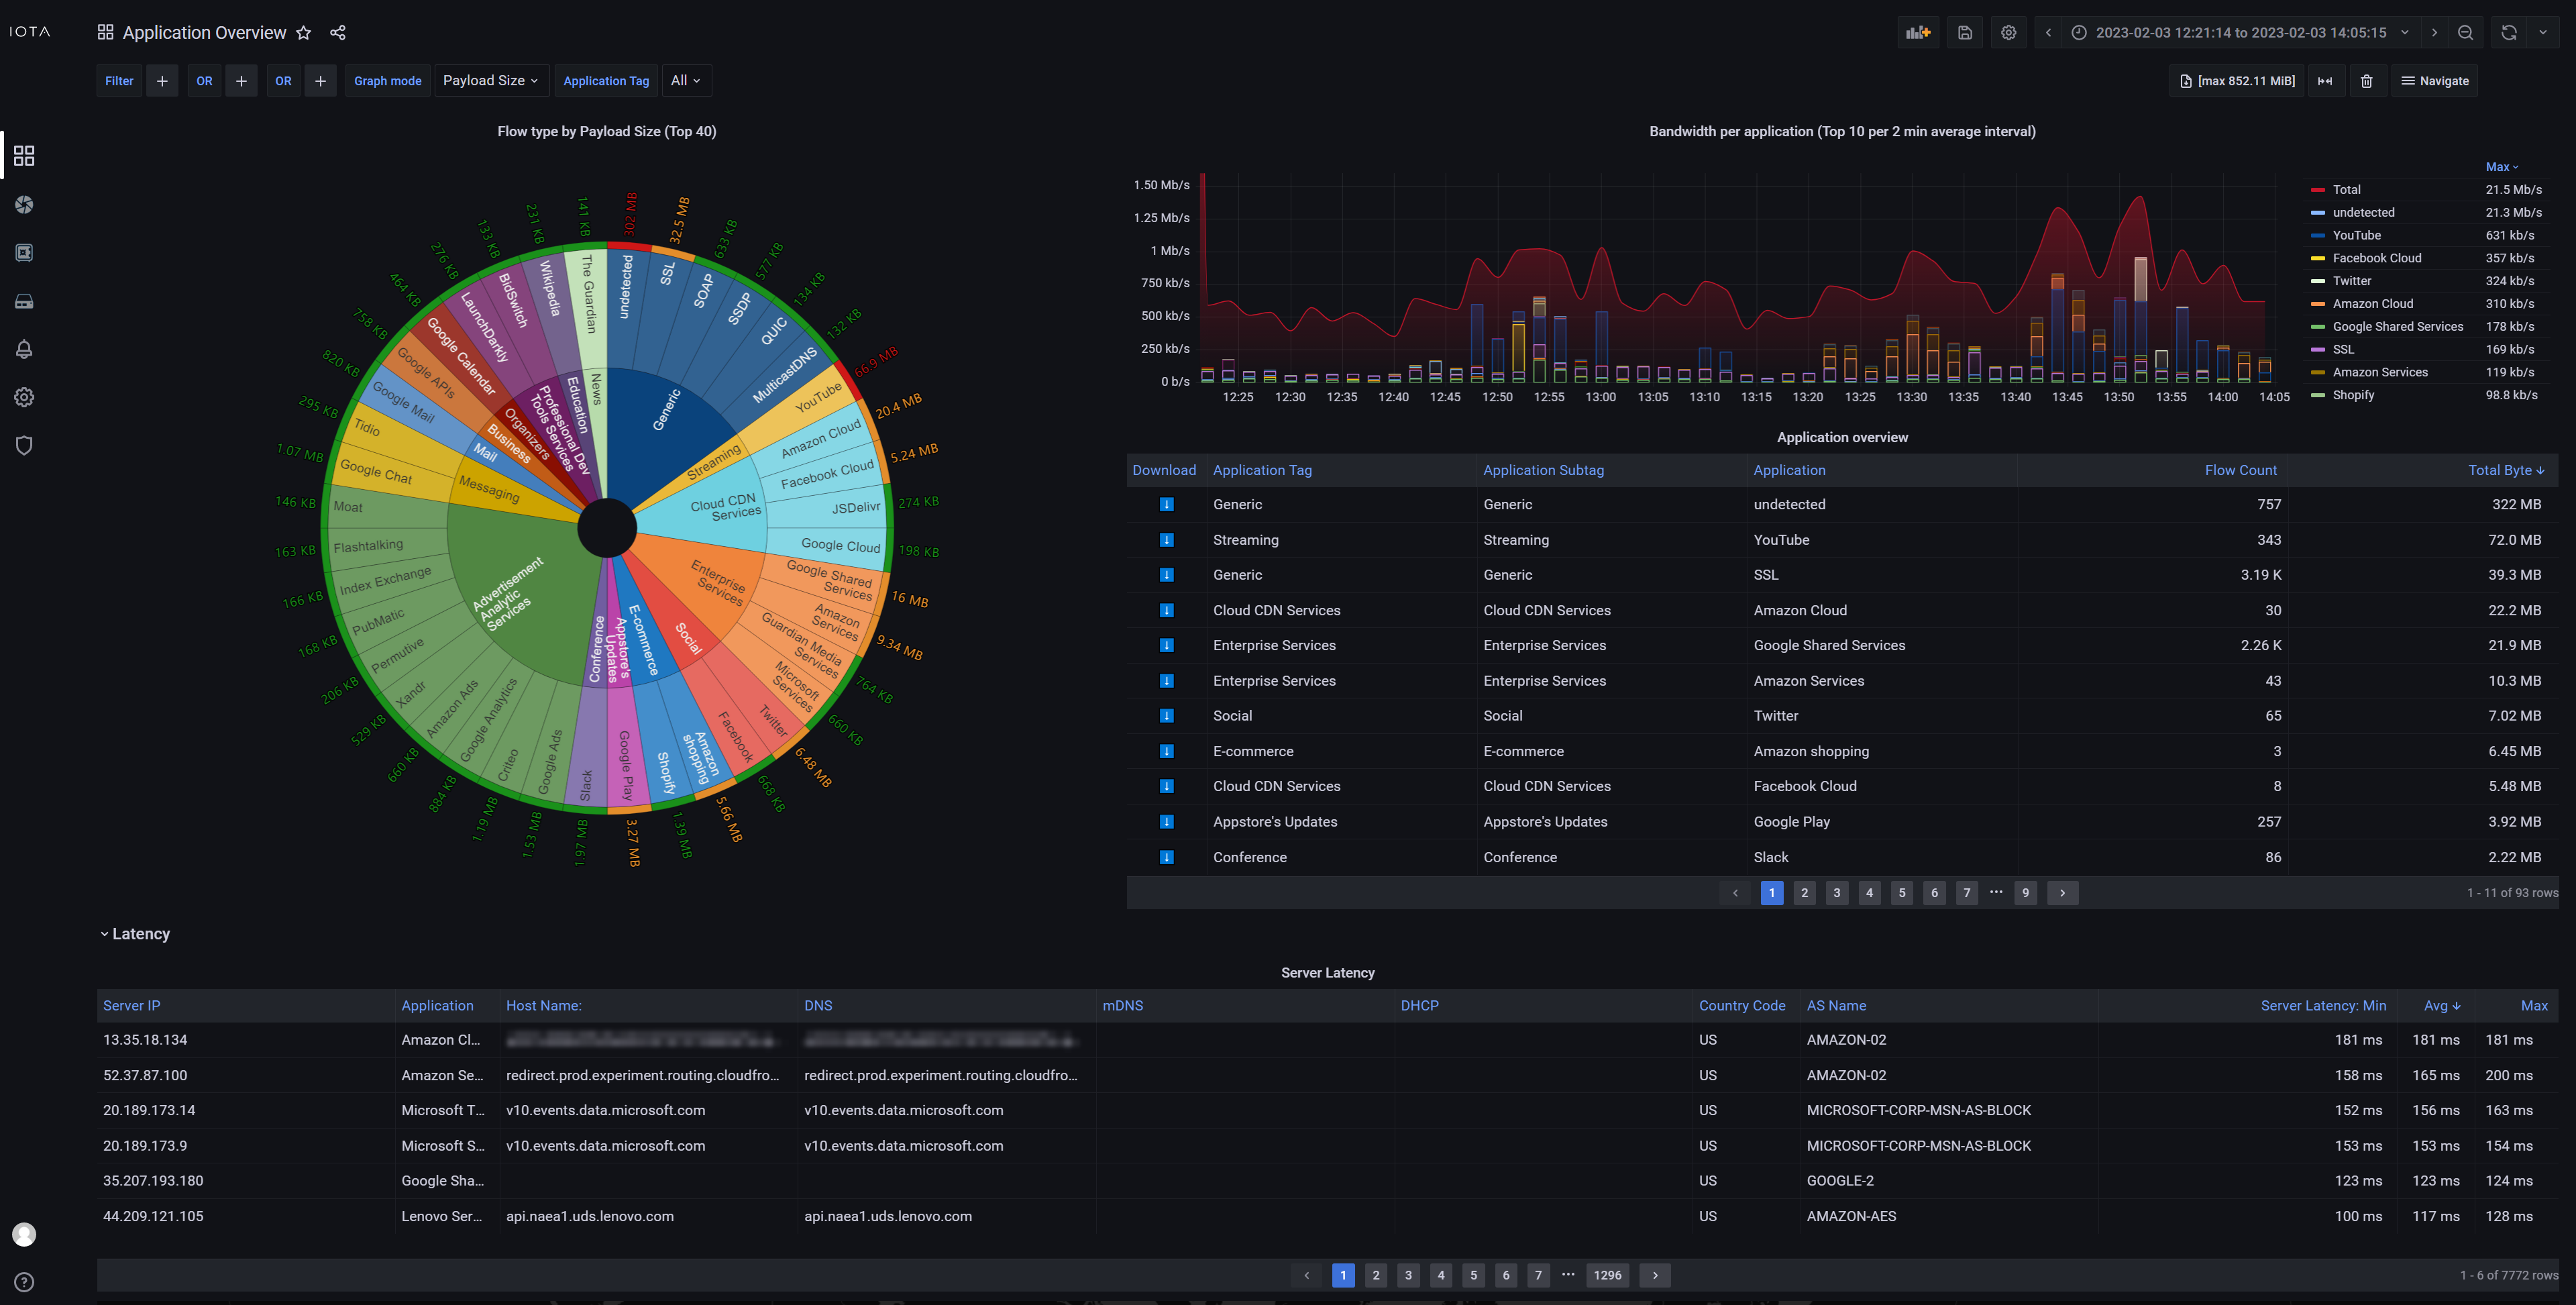
Where the Overview dashboard shows who is talking to whom, the Application Overview dashboard shows what they are talking about. The data in this dashboard is categorized by application type, and by application. The graph can be changed to display latency, flow count, and payload size. This dashboard is a great starting point when analyzing application issues. It gives a clear overview of which components may be slowing your applications down. It can also help finding unexpected services, and services consuming too much bandwidth.
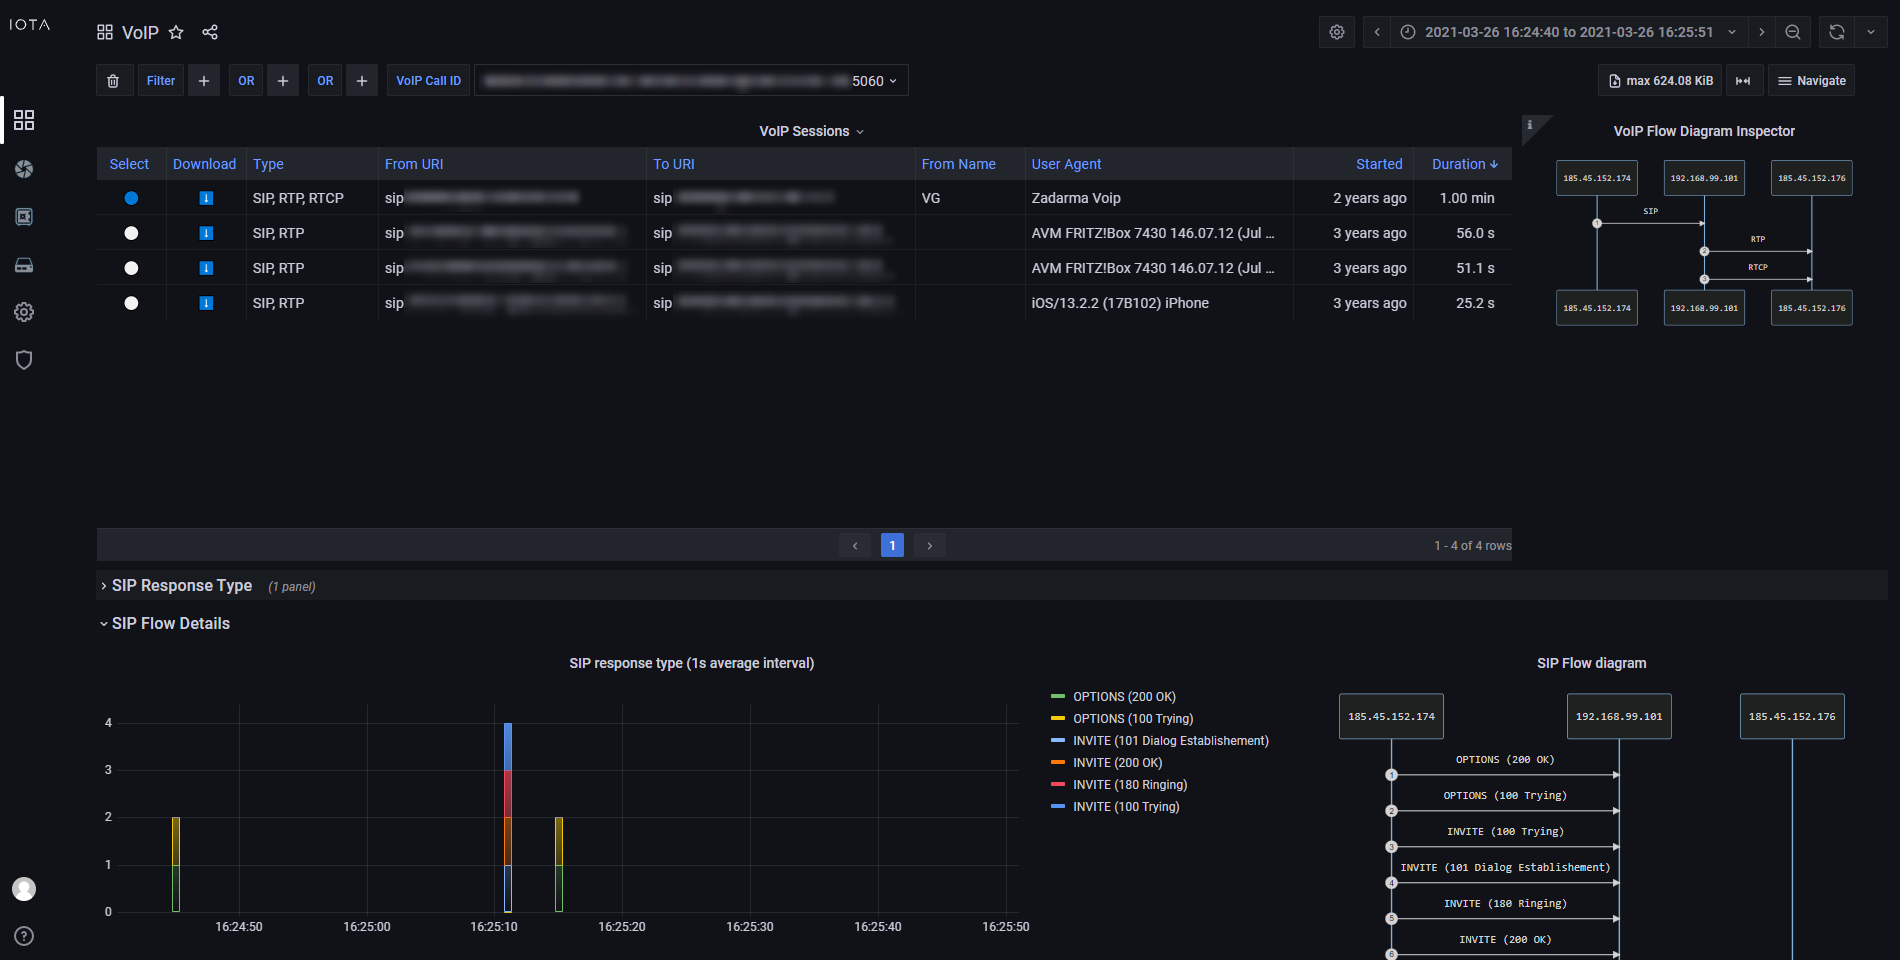
Provides an overview of recorded VoIP sessions, with the possibility to dig down on SIP and RTP metrics and details. The VoIP Sessions table provides a complete view of detected sessions with cross-correlation between control and data traffic. From this table, selecting a specific VoIP session is possible, allowing inspection of session-specific details in the various dashboard sections. The call flow is visualized in VoIP and SIP flow diagrams, to help get a better overview of the call details. The dashboard also provides MOS scores for a quick indication of call quality.
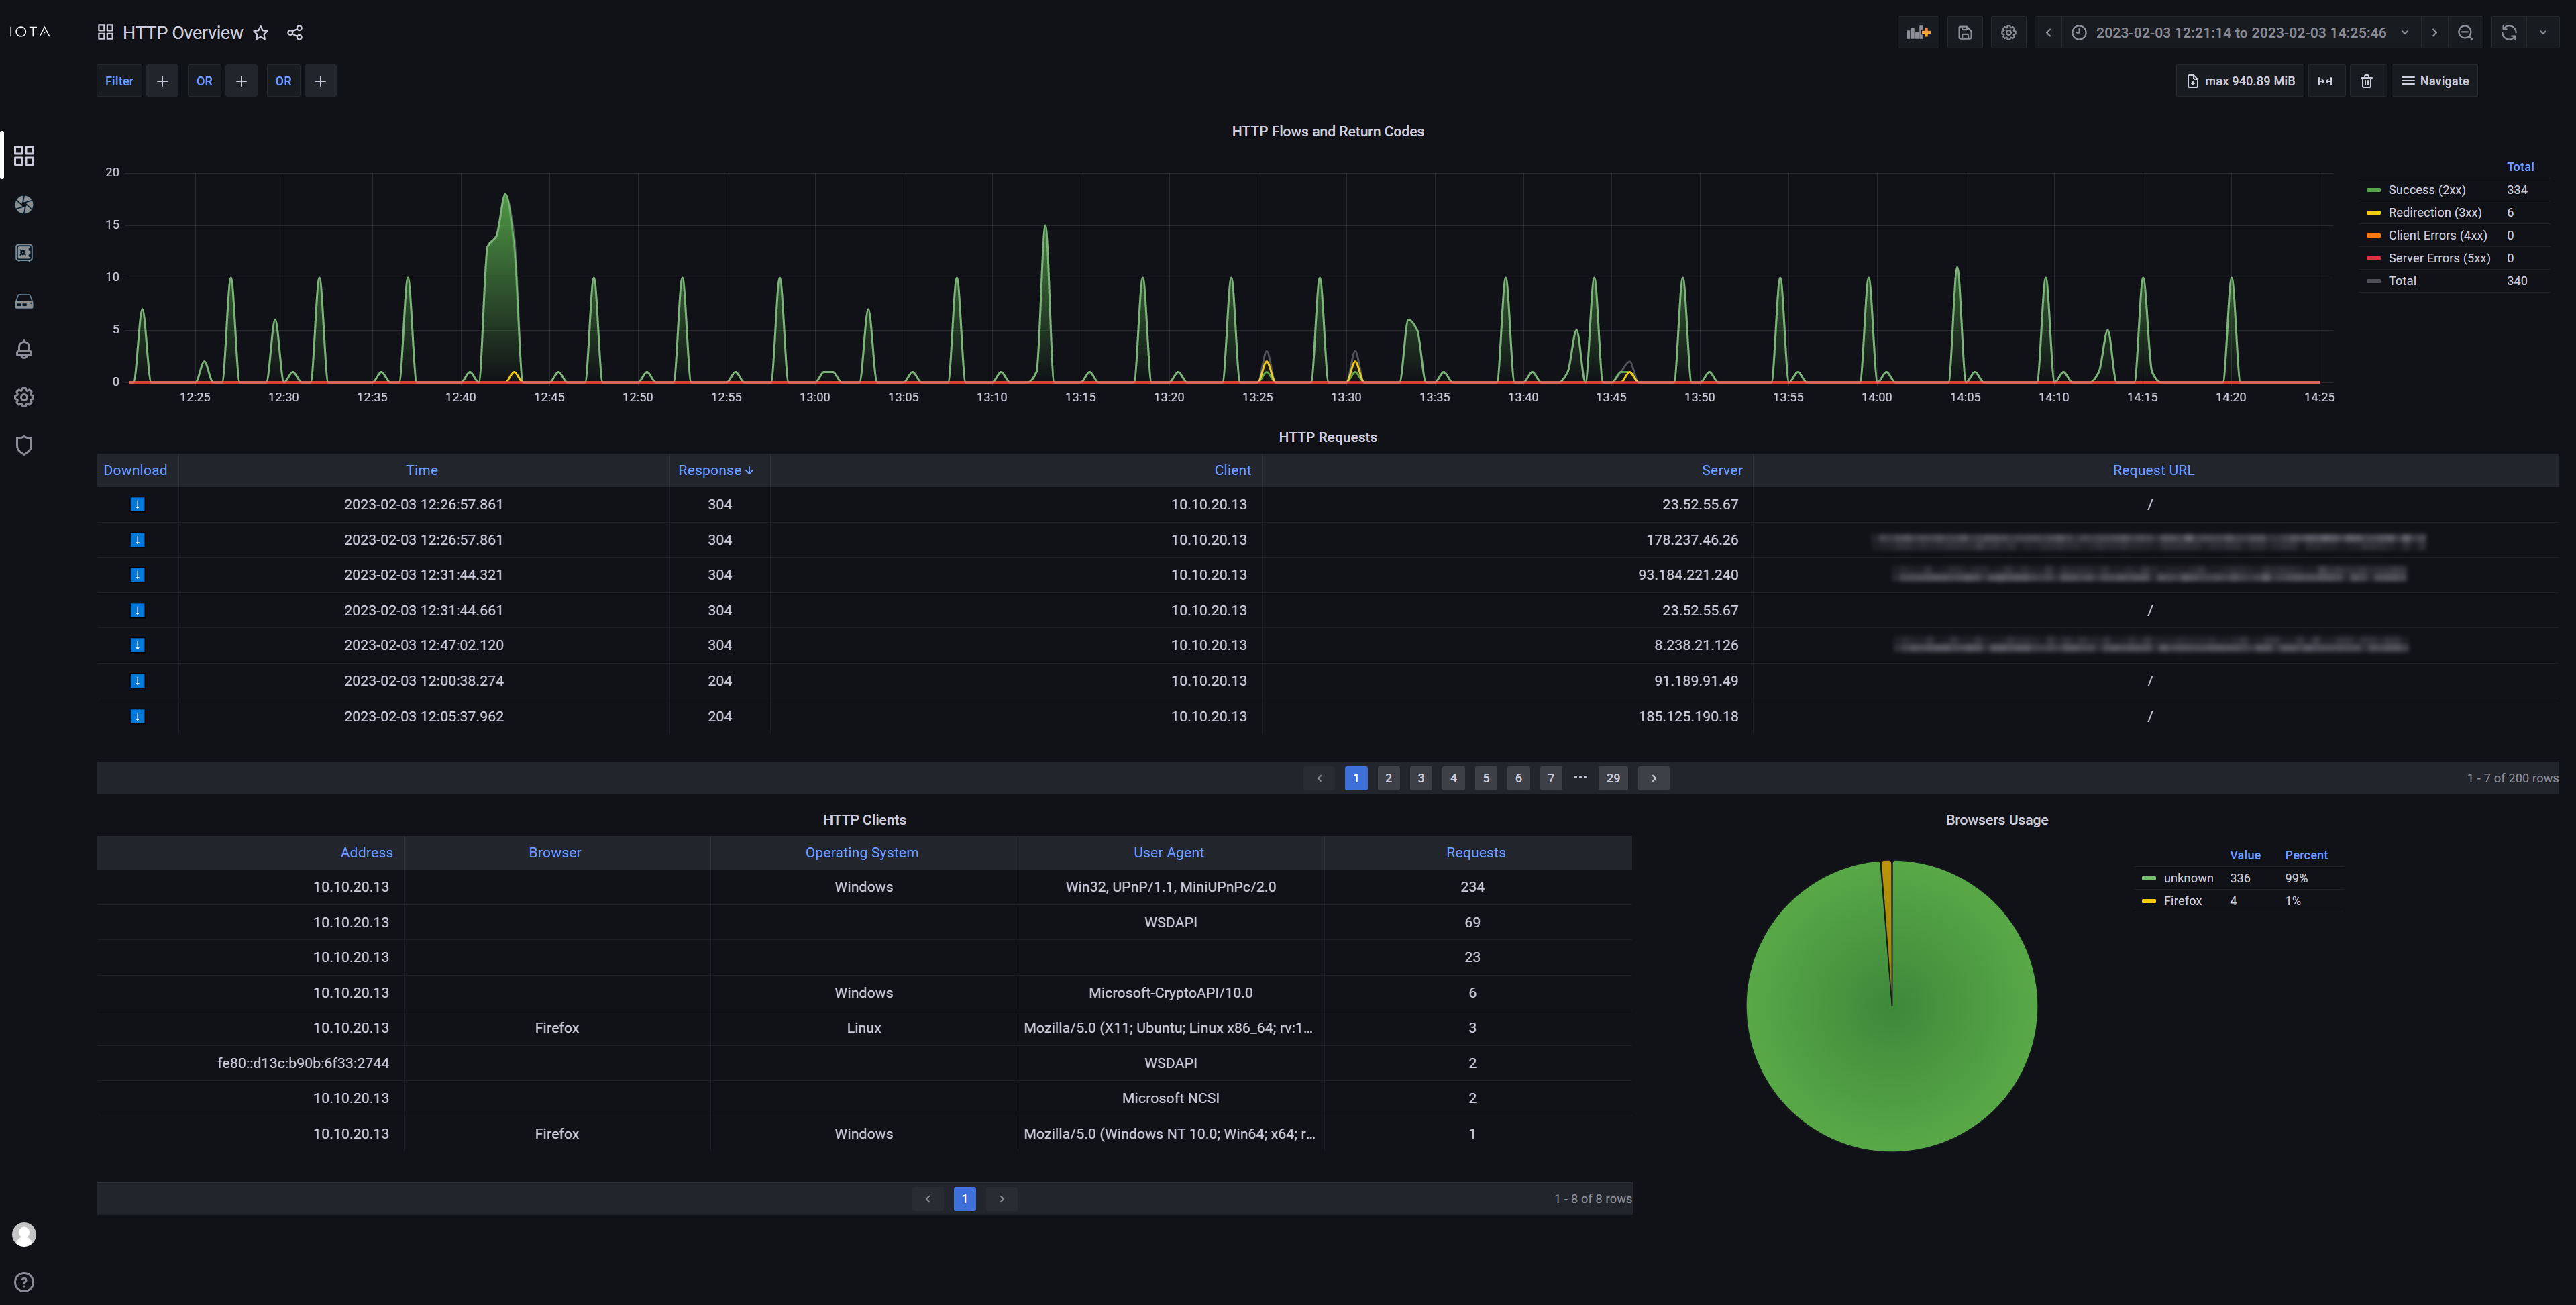
This dashboard provides an overview of HTTP traffic, to help monitor HTTP application traffic, distinguish between different return codes, see each different flow, and filter on them.
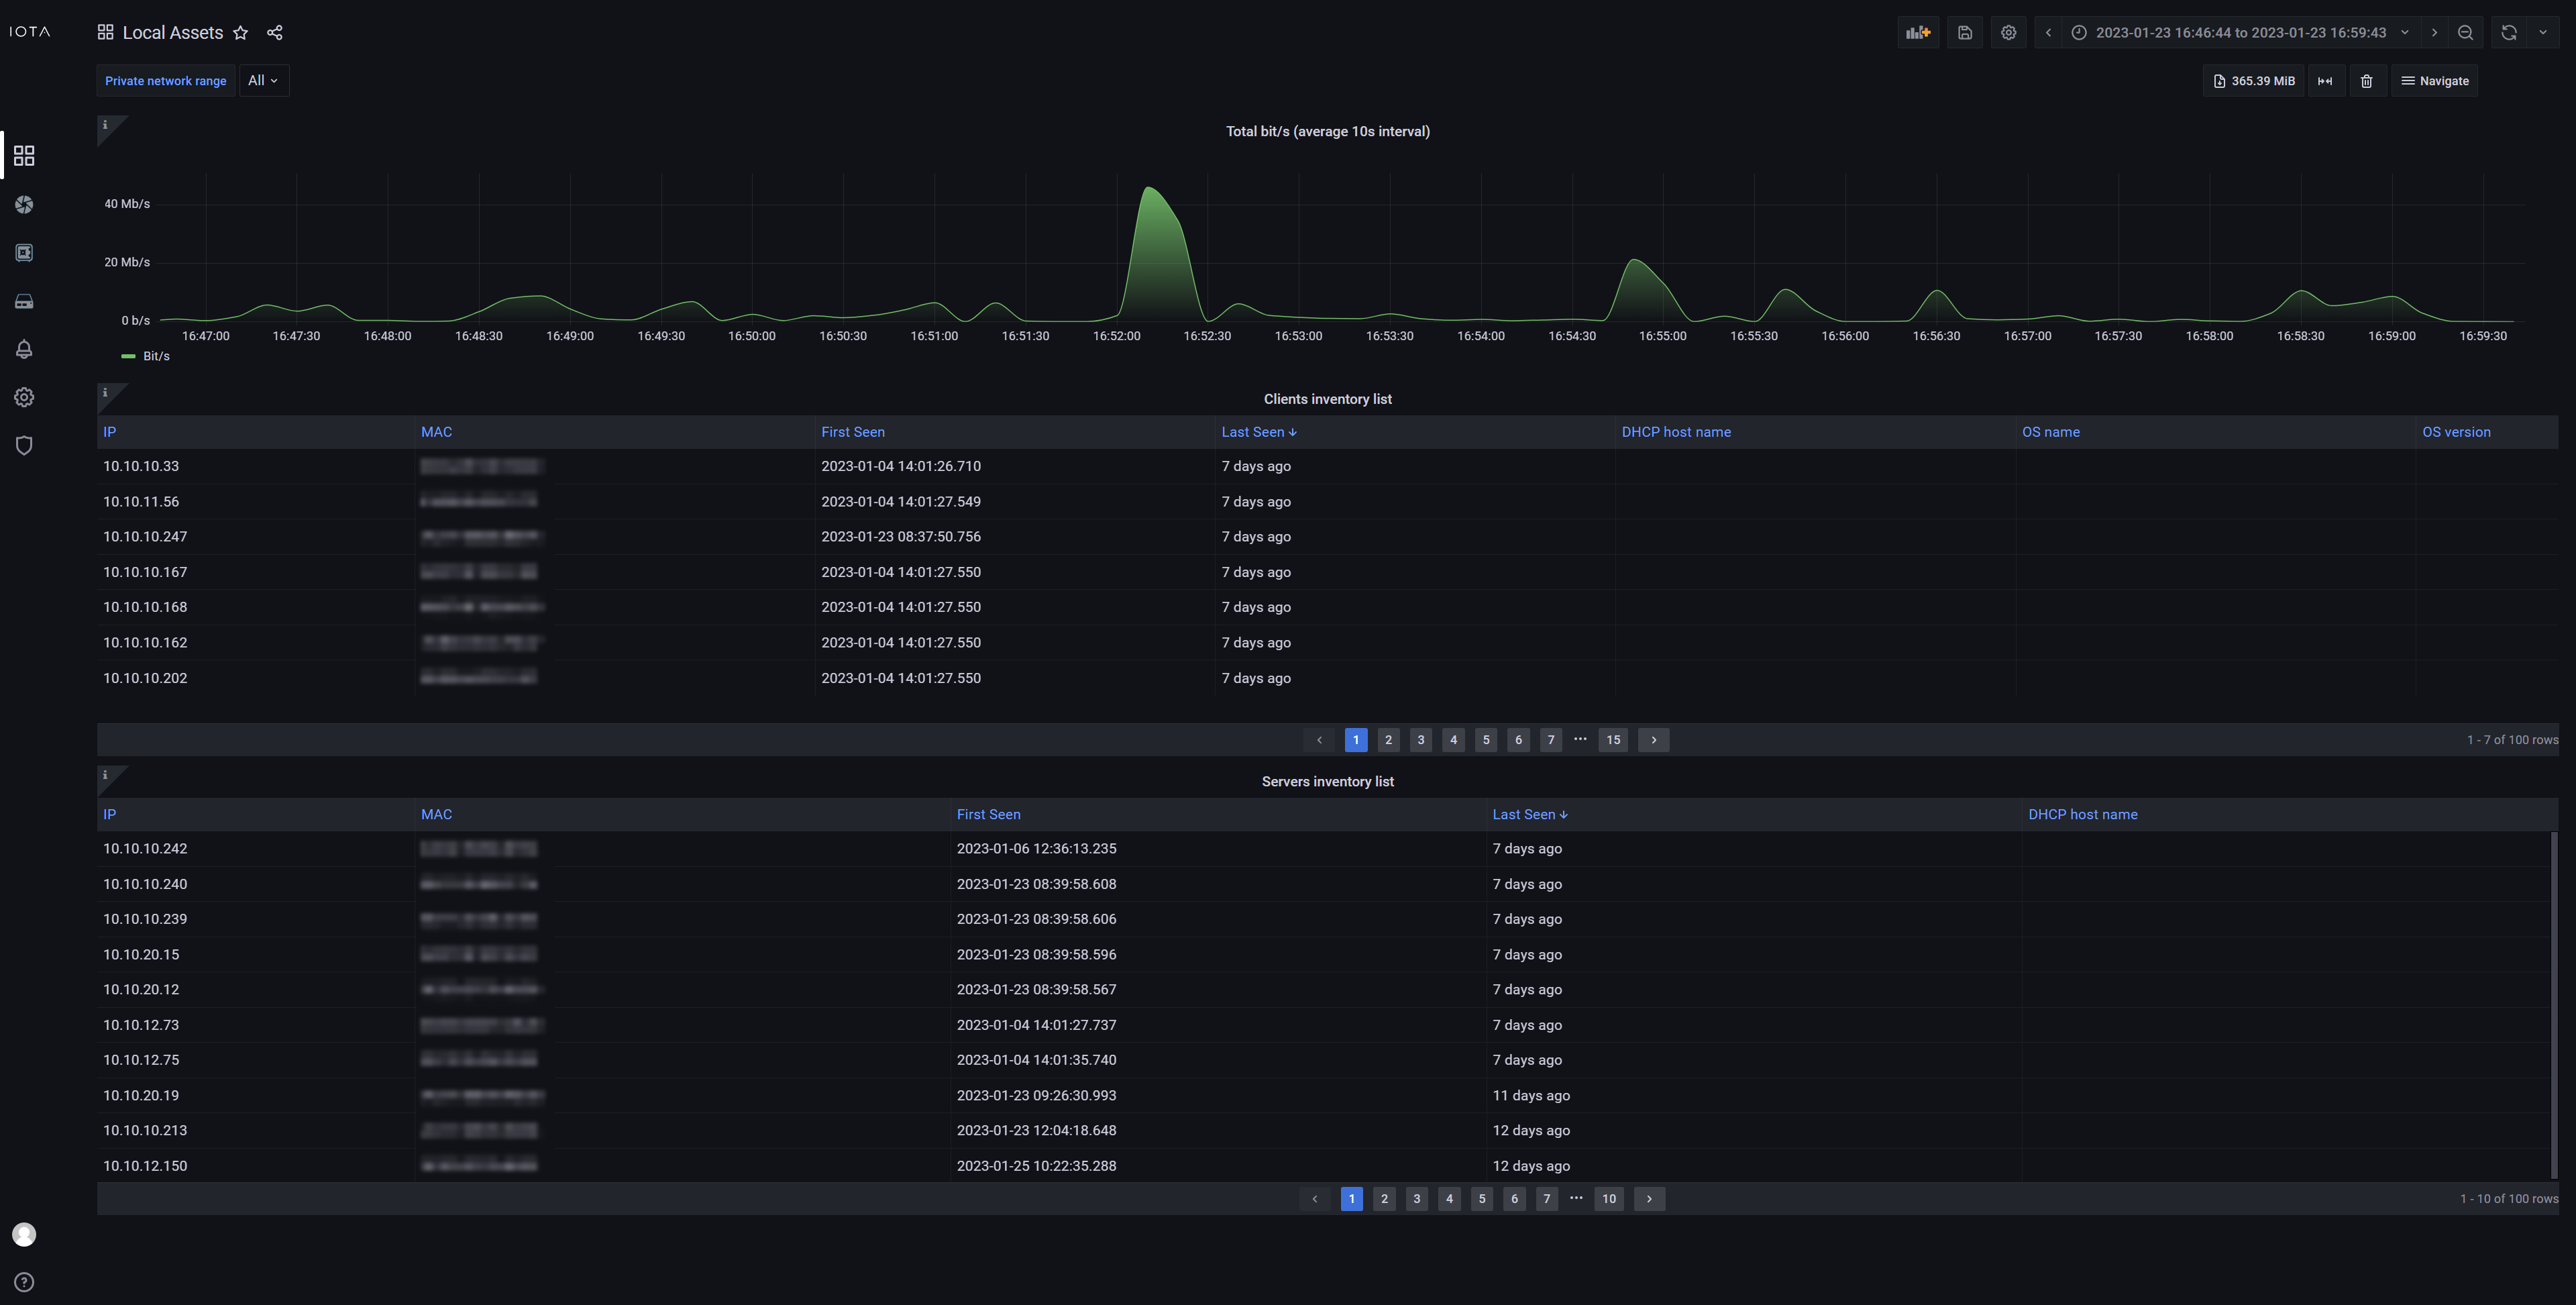
The Local Assets dashboard lists speaking interfaces present in the local network, based on the canonical private IP address ranges (RFC 1918 & RFC 4193). It helps to keep track of devices in the local network, and also unveil potentially unwanted devices. The bandwidth usage for the selected time range and filters is displayed on a chart. The DHCP host names of devices are displayed whenever possible. Clicking an IP address in the list navigates to the Host Details dashboard for that address.
The Modbus Overview dashboard displays Modbus protocol message distribution over time, allowing you to troubleshoot industrial networks which contain Modbus traffic. The servers and clients that are part of the Modbus network are listed in a table.
This dashboard provides an overview of TLS-encrypted connections and whether they are considered safe, weak, or unsafe, based on the TLS version and cipher used. Connection information can be sorted and filtered to visualize and identify potentially problematic connections.
This dashboard gives an overview of TCP-related statistics, such as client IP, server IP, host names, iRTT, and more, such as an analysis of TCP connection completeness. Various graphs are available, providing different perspectives on the TCP traffic and offering full diagnostics of the TCP protocol. You can easily filter on common TCP-related attributes via the filter menu. Color coding of TCP analysis states helps give an at-a-glance view of the data transmission process.
The DNS overview dashboard gives you an overview of DNS queries over time, top servers, and top queries by type. This dashboard helps troubleshooting starting from a specific domain and then following the associated flows. This gives a general idea of how your queries are spread out over time.
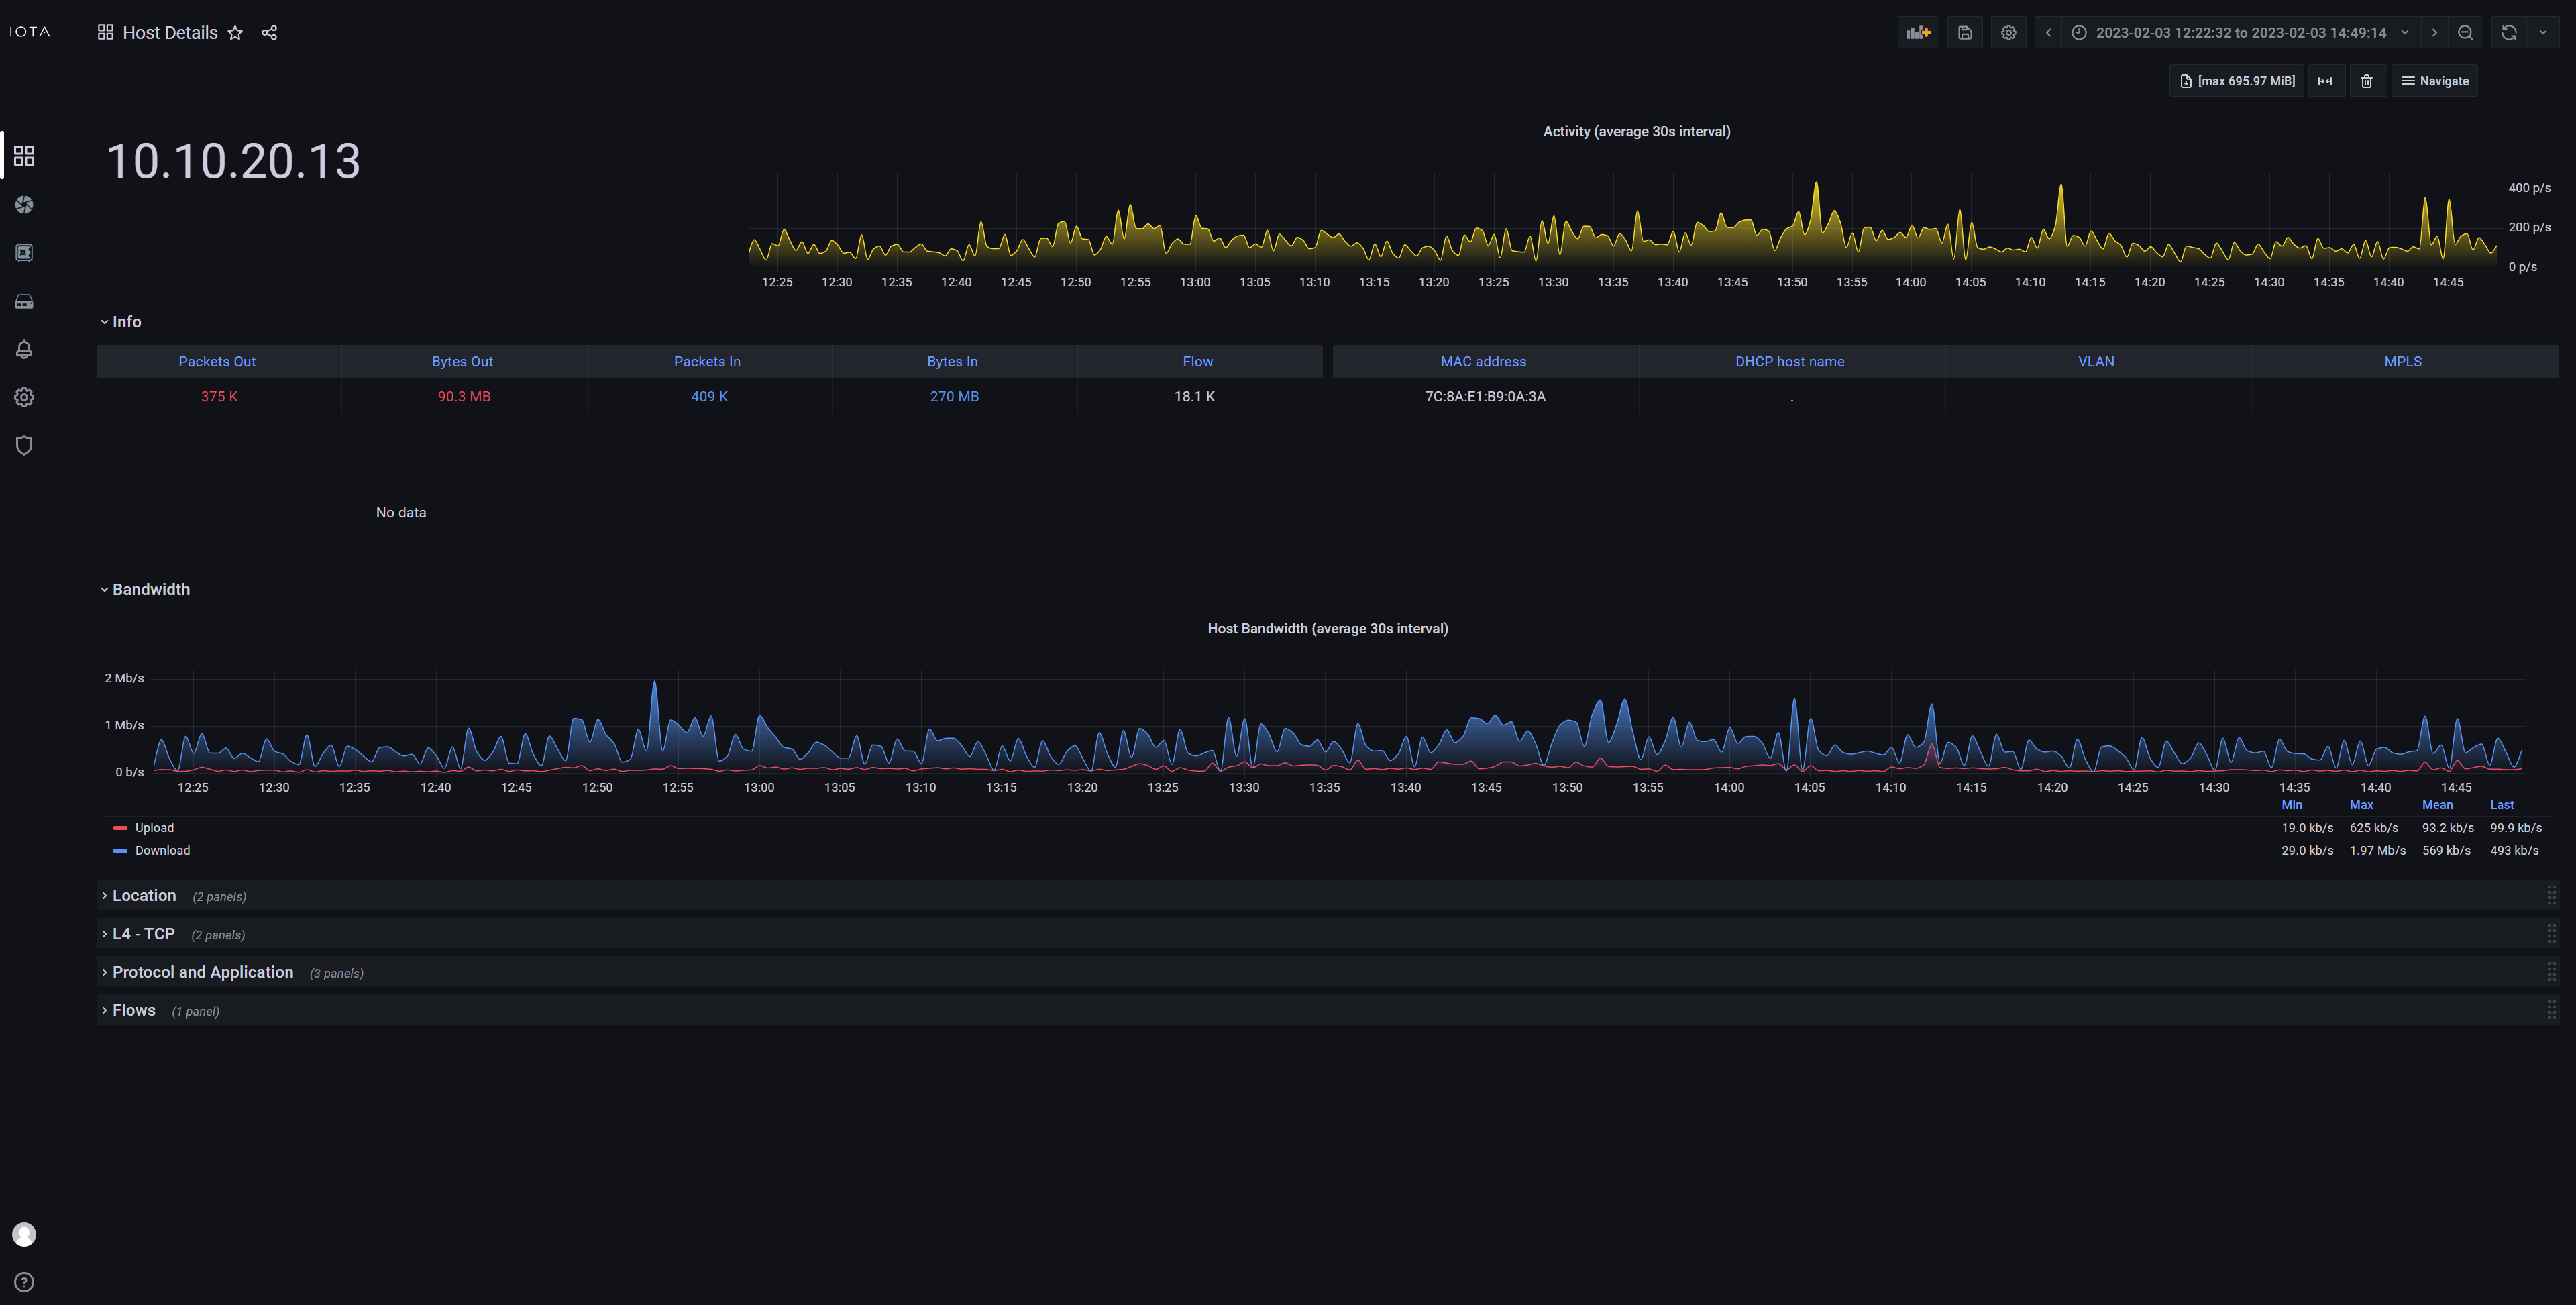
The Host Details dashboard is available every time an IP address is clicked. This dashboard provides a deep-dive into network activity specific to the filtered IP, and all the metrics you can use to analyze network issues based on geolocation, TCP data, protocol and application information, and flows.
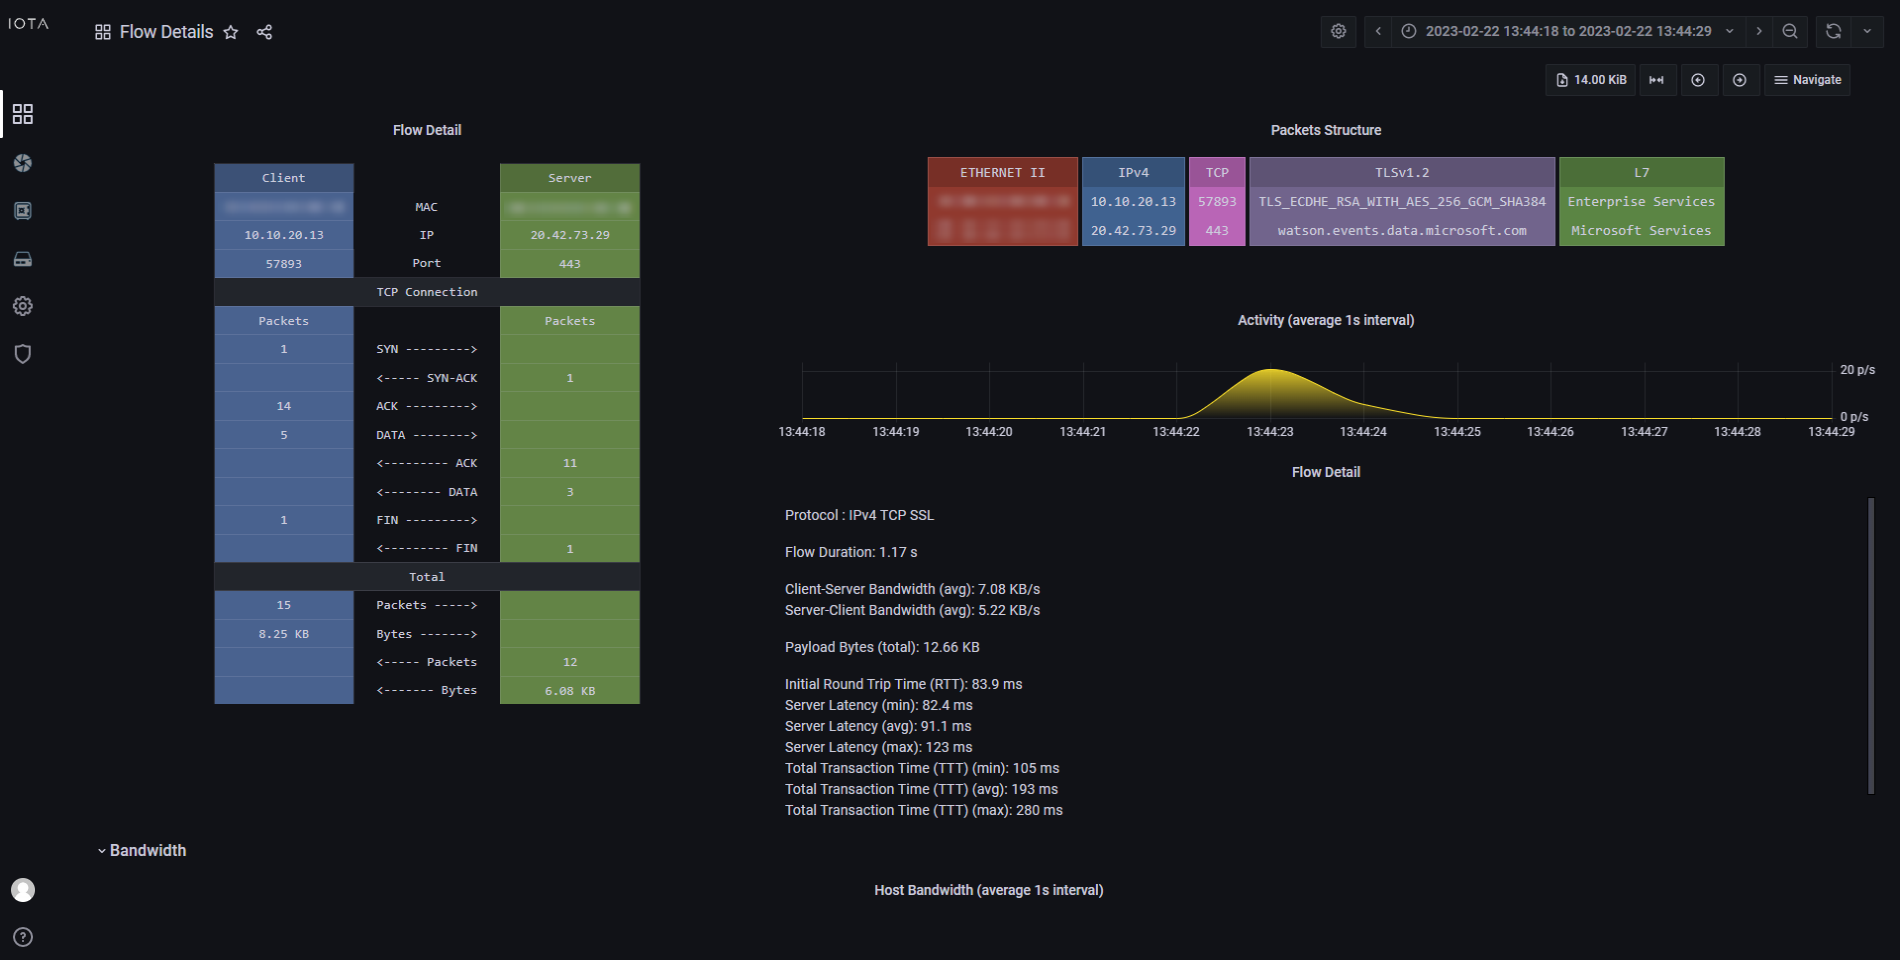
The Flow Details dashboard is accessible by clicking the Inspect (🔍) button on any of the flow tables located in various dashboards. This visualization is useful for inspecting the details of one specific traffic flow. The top-right diagram will display the different protocol headers used in the communication and their main fields. On the left side, there are more in-depth details on packets exchanged inside the communication flow. The dashboard also provides traffic metrics like total payload, bandwidth usage, and the number of packets.
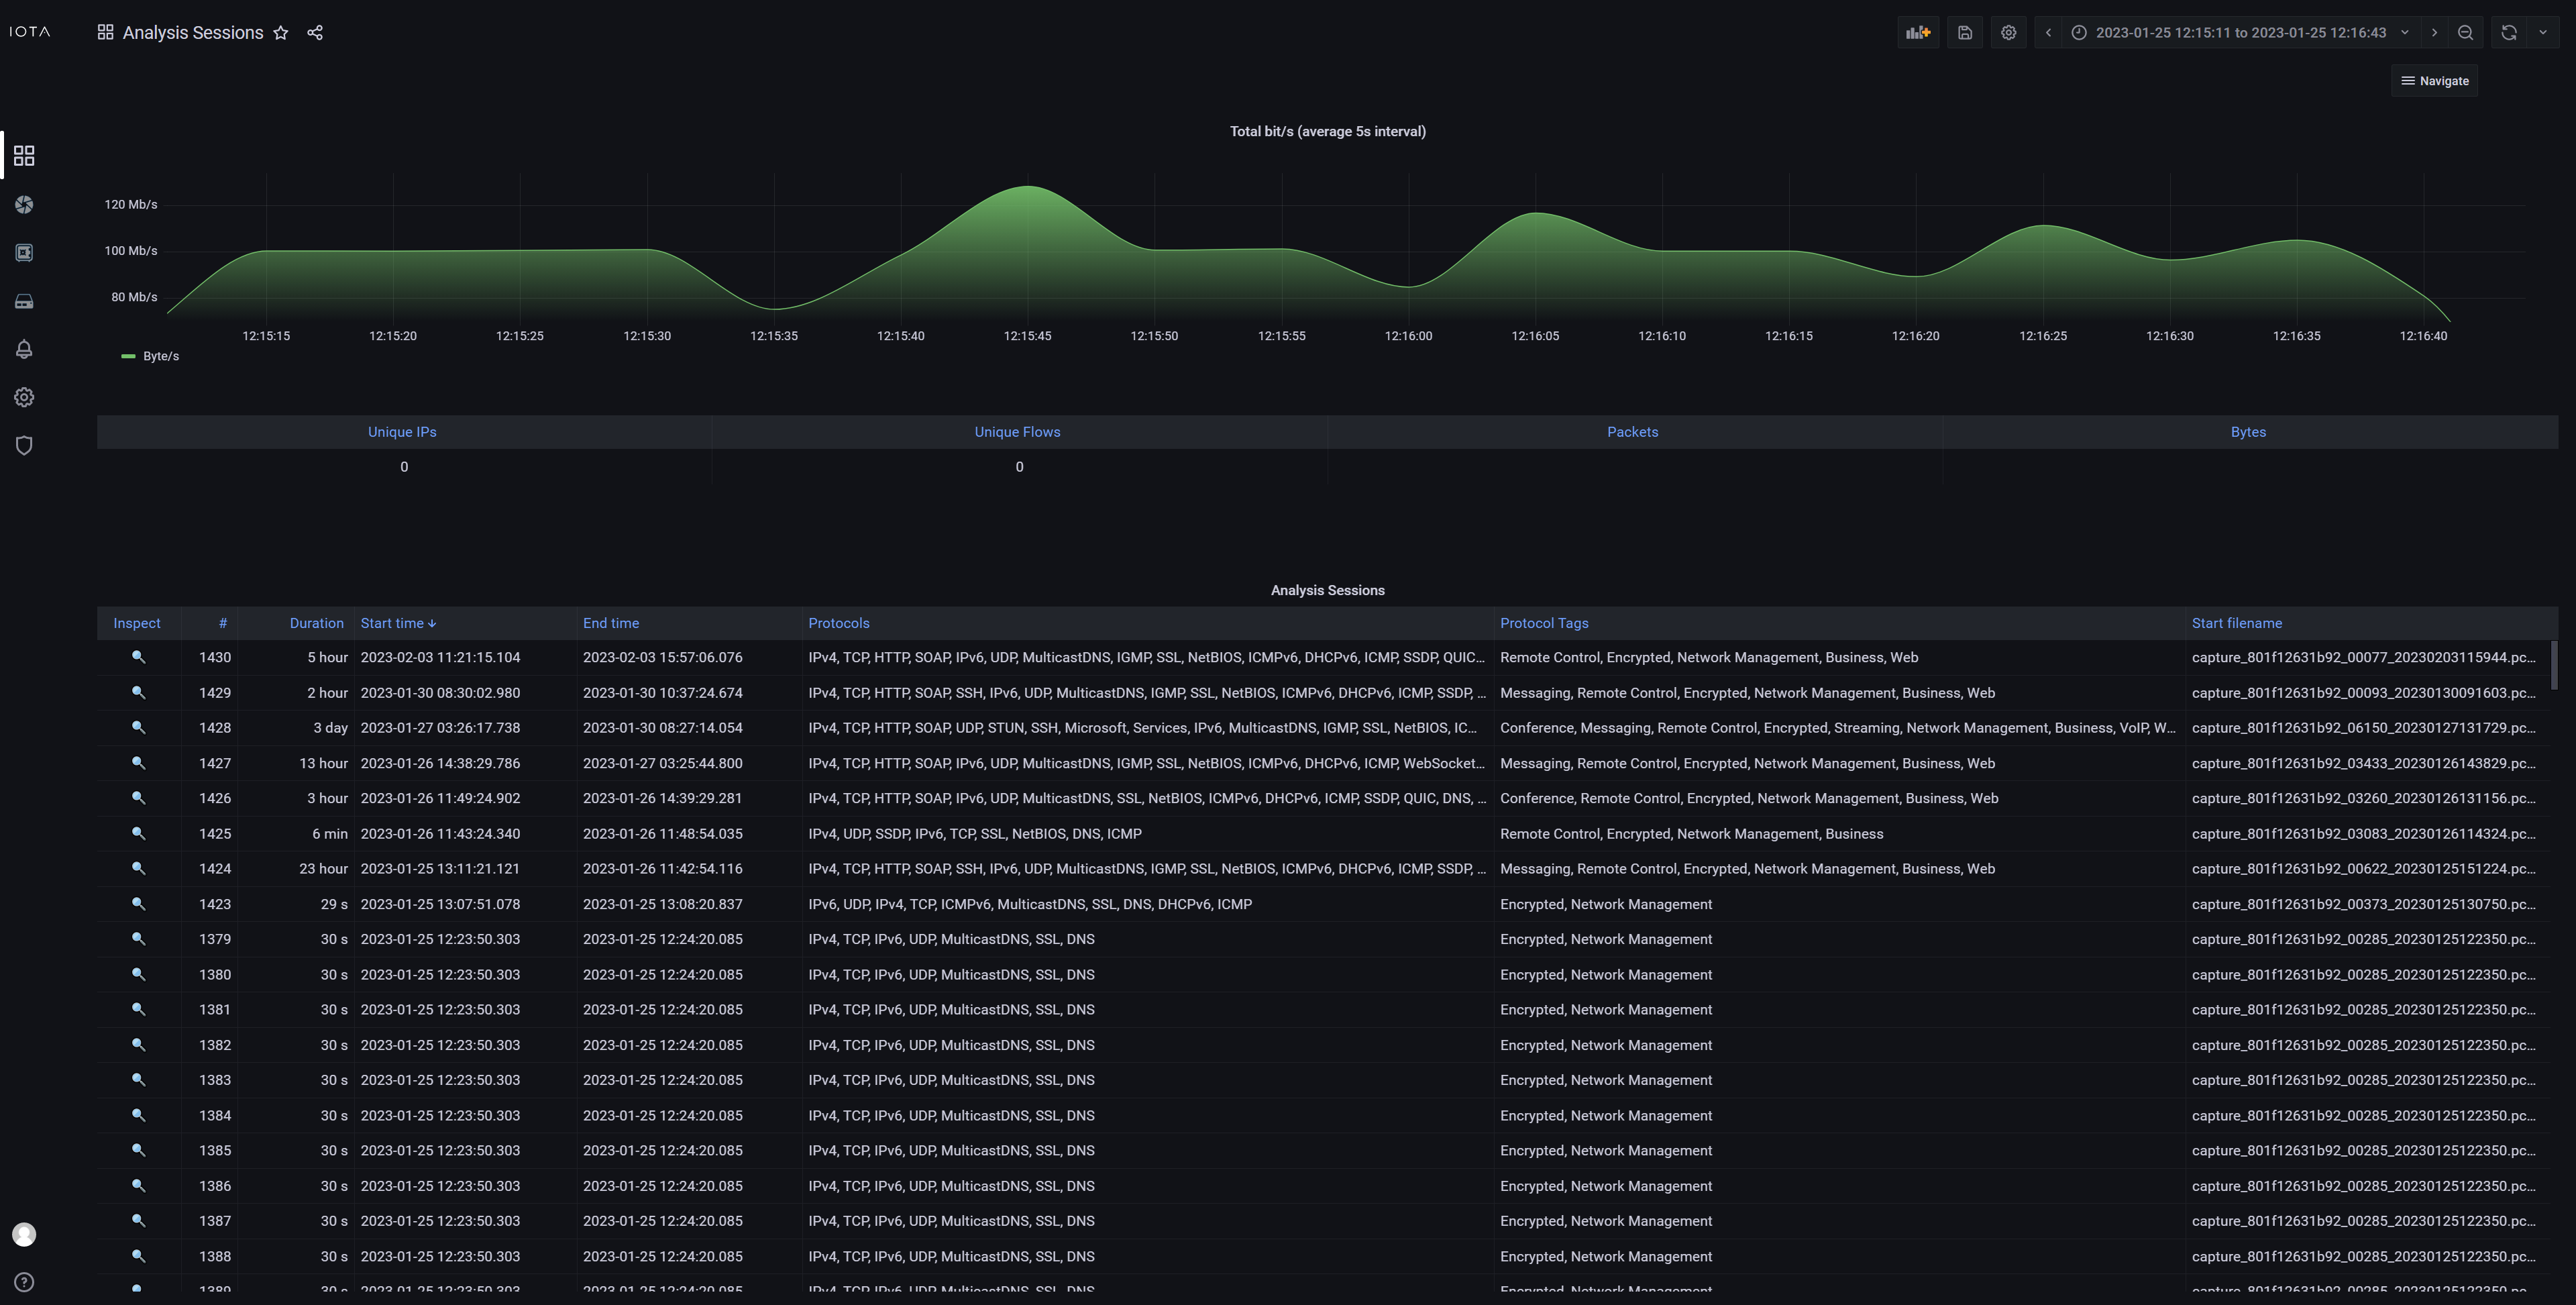
When a capture & analysis session is started, it will appear in this dashboard. This makes it easy to review or go back to an earlier session instantly. It’s also possible to find different analysis sessions by time. A “session” represents a self-standing correlation domain. A timeout determines whether captured and analyzed data is still part of the current session, or if it belongs in a new session.

IOTA use case
Application Latency Analysis
More and more applications are provided by cloud providers as SaaS from globally distributed data centers. Normally, this offers easy application deployment. However, it also brings new error sources that can affect application performance. For example, latency issues can lead to sluggish applications and even timeouts in those applications. With packet loss, similar behavior occurs, and retransmissions are visible.
IOTA use case
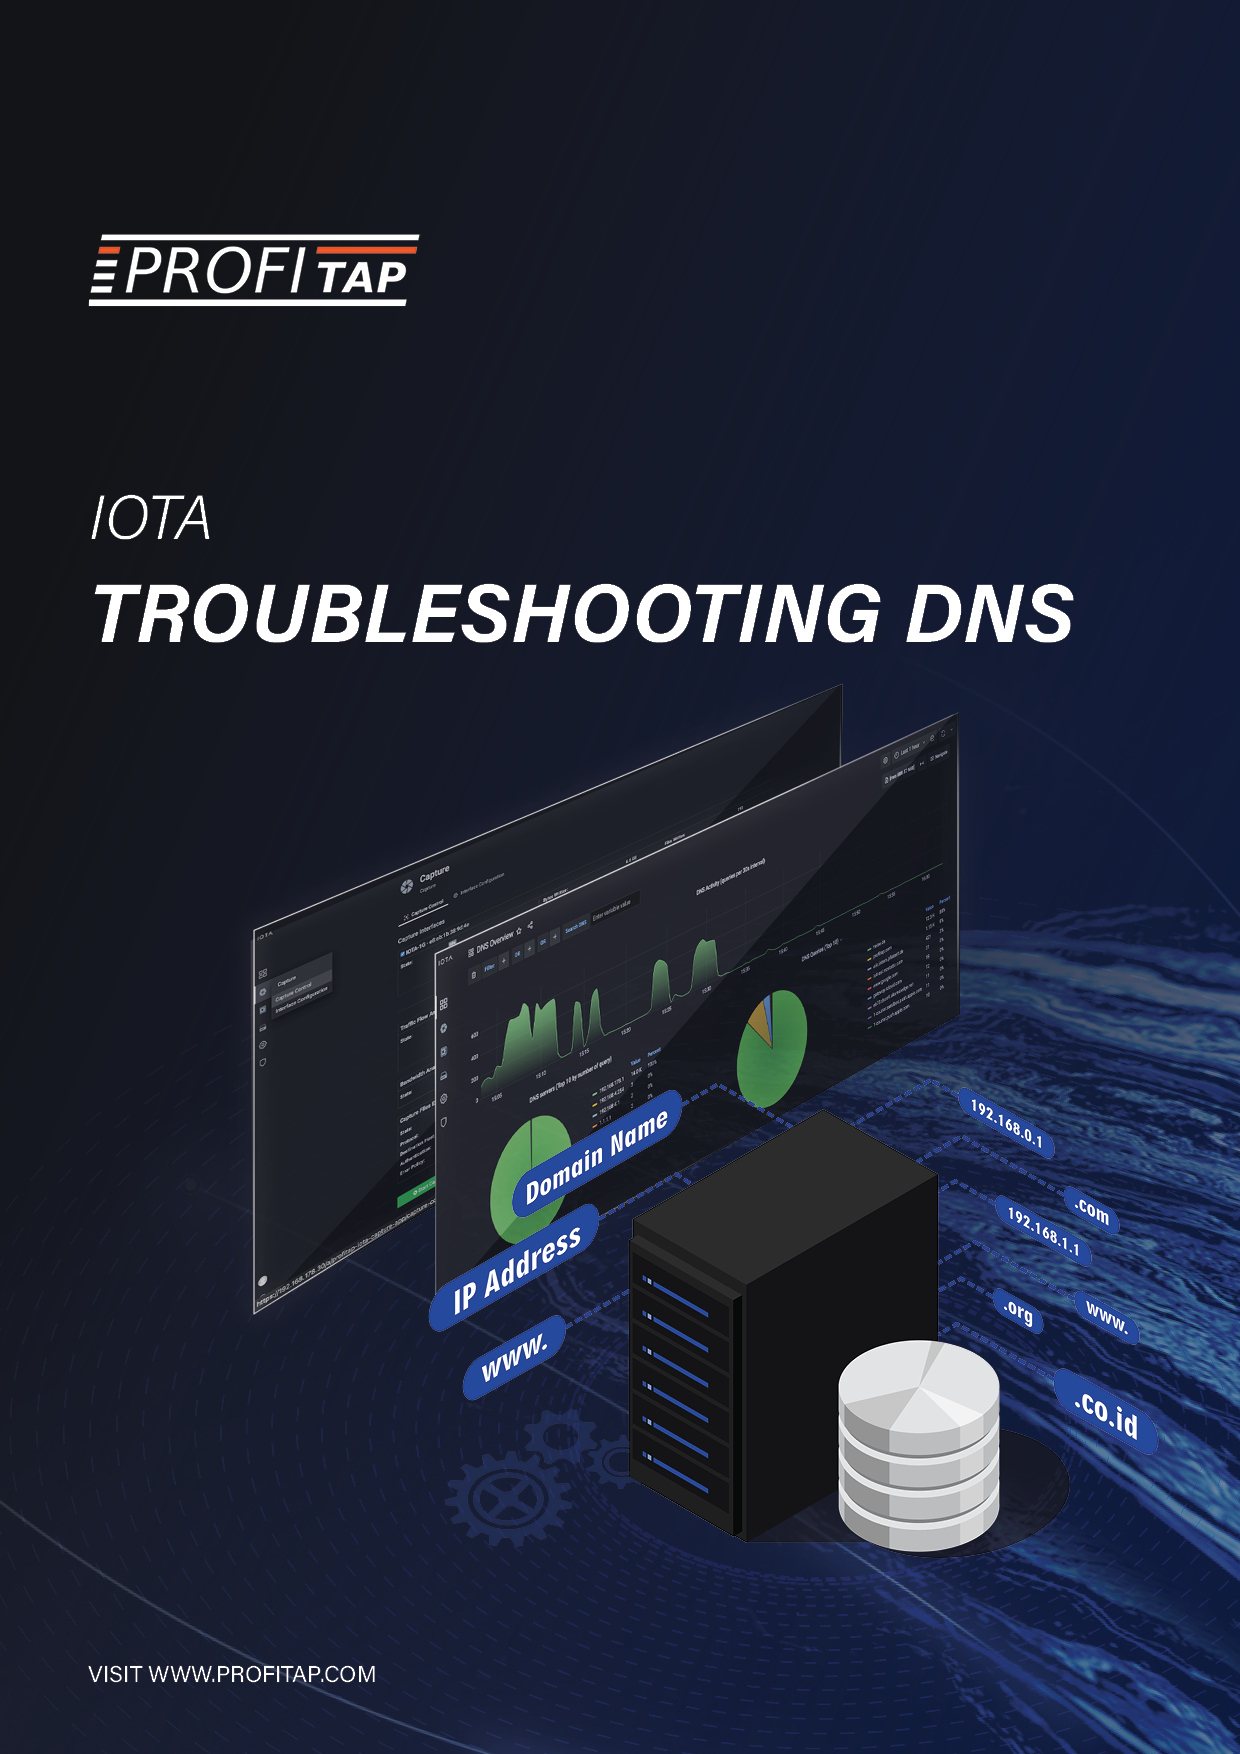
Troubleshooting DNS
There is a saying: “It’s not DNS. There is no way it’s DNS. It was DNS”. This makes it clear that DNS is an integral part of IT infra-structure services and can exhibit a wide variety of error patterns. For example, DNS can lead to applications not starting or starting with delays. Sometimes, this is due to incorrectly stored DNS records or performance bottlenecks on DNS servers. However, overly restrictive firewalls cause problems in some cases since some system integrators only support DNS over UDP. With large responses, however, DNS switches to TCP. Certificate errors in browsers can also indicate incorrect DNS entries.
Get a Quote
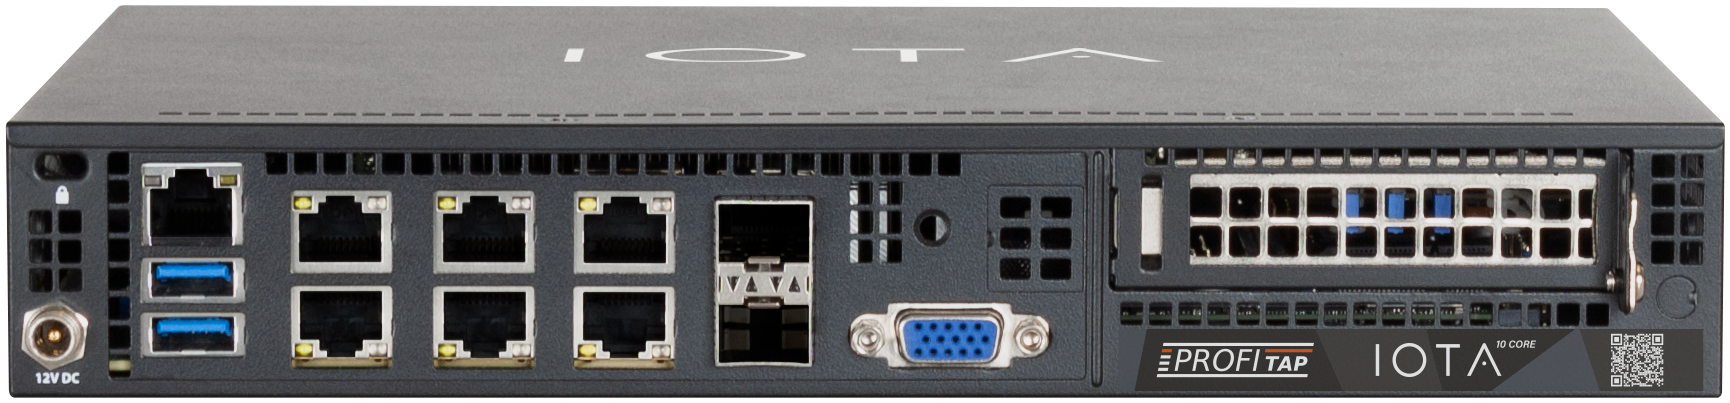
Connectors
2 x 100M/1G RJ45 capture
2 x 1/10G RJ45 capture
2 x 10G SFP+ capture
2 x RJ45 management
1 x RJ45 IPMI
2 x USB 3.0
1 x 12 VDC power
Dimensions (WxDxH)
265 x 226 x 43 mm
10.43 x 8.9 x 1.69 in
Weight
2100 g
4.63 lb
Speed
100M/1G/10G
Capture performance
20 Gbps
10 Mpps
Storage
4, 8, or 16 TB SSD
Compliance
RoHS, CE, FCC, UKCA, EAC
Accessories
Rackmount kit with power adapter bracket
100-240 VAC to 12 VDC, 12.5 A, 150 W power adapter
Related Products
IOTA 1G
IOTA 1G is a multifunctional passive network probe with integrated traffic capture and analysis capabilities.
ProfiShark 10G
ProfiShark 10G is a versatile solution, providing total visibility into 1G & 10G, Copper & Fiber networks through USB 3.0.